Swift — Benchmark Results
Generated: 2026-07-24T20:24:25.567549
This page is a snapshot of measured numbers for Swift on one machine. Continuous integration deploys the documentation site; it does not re-run analysis when docs are published. Re-running benchmarks on another computer will usually change the numbers a little.
| Topic | Where to read |
|---|---|
| Which libraries we measure, and caveats | Swift overview |
| I/O modes and run modes | Modes |
| How CSVs become these tables | Analysis methodology |
| What each metric means | Metrics catalog |
| All languages’ result links | Results summary |
How to read these tables
Compare serializers inside this language. Prefer the same category (for example JSON with JSON) and the same I/O mode so the comparison stays fair.
| Term | Meaning |
|---|---|
| data type | Sample shape: message, document, telemetry, strings, or event (CSV TestDataName; older text may say “fixture”) |
| bytes mode | In-memory buffer API (encode to bytes / decode from a buffer). On C# this is often the string path — see Modes. |
| stream mode | Stream-style API (write/read through a stream). May be native or adapted — see Modes. |
| µs | Microseconds (one microsecond = 1000 nanoseconds). Tables show µs; raw CSVs store nanoseconds. |
| Ops/s | Operations per second from mean total time — higher is faster |
| Bold | Best value in that column (lowest time/size; highest ops/s). Ties are all bolded. |
Rows are sorted by serializer name (easy lookup), not by rank. Batch workloads appear as Data type · N instances (for example Message · 100 instances). Default multi-serializer tables show high-importance metrics only; pairwise / version A/B reports can show the full set (Metrics).
Stream honesty: all stream rows are
adapted(in-memory encode/decode then dump to a stream, or equivalent). Do not treat stream columns as proof of incremental I/O. Labels: adapted 140. See Modes — stream honesty.
Summary tables
Summary
One row per serializer (averaged across data types; bytes mode preferred when both exist). Only high-importance columns appear here by default (Metrics catalog). Times are µs. Bold = best in that column.
| serializer | Median total (µs) | Median ser (µs) | Median deser (µs) | Ops/s (from mean) | Median size (B) | Samples | Fidelity |
|---|---|---|---|---|---|---|---|
| BinaryCodable:4.0.0 | 1,820 | 1,270 | 554 | 11.4K | 13.4K | 1751 | 1.00 |
| CapnProto:capnproto-1.0.2 | 1,000 | 787 | 216 | 18.5K | 18.3K | 1686 | 1.00 |
| FlatBuffers:24.3.25 | 692 | 602 | 90.3 | 47K | 17.4K | 1721 | 1.00 |
| Foundation.JSONEncoder:Foundation | 1,740 | 1,170 | 569 | 12.2K | 19.7K | 1727 | 1.00 |
| Foundation.PropertyListEncoder:Foundation | 2,740 | 1,330 | 1,410 | 7.66K | 16.3K | 1743 | 1.00 |
| IkigaJSON:2.5.3 | 1,750 | 1,100 | 651 | 12.8K | 19.7K | 1723 | 1.00 |
| SwiftAvroCore:2.3.0 | 2,560 | 1,990 | 569 | 7.37K | 9.02K | 1773 | 1.00 |
| SwiftBSON:3.1.0 | 3,760 | 1,950 | 1,820 | 6.48K | 20.7K | 1757 | 1.00 |
| SwiftCbor:0.0.4 | 2,410 | 1,570 | 836 | 9.11K | 13.6K | 1759 | 1.00 |
| SwiftMsgpack:1.2.1 | 2,290 | 1,460 | 828 | 9.57K | 13.6K | 1771 | 1.00 |
| SwiftProtobuf:1.38.1 | 426 | 376 | 49.5 | 65.8K | 10.1K | 1679 | 1.00 |
| TOML:2.0.0 | 5,210 | 4,030 | 1,180 | 4.9K | 22.4K | 1757 | 1.00 |
| XMLCoder:0.18.2 | 14,700 | 7,860 | 6,810 | 1.83K | 34K | 1806 | 1.00 |
| Yams:5.4.0 | 13,300 | 9,420 | 3,880 | 1.93K | 22.5K | 1791 | 1.00 |
Total Time
| serializer | bytes mode/mean | bytes mode/median | stream mode/mean | stream mode/median |
|---|---|---|---|---|
| BinaryCodable:4.0.0 | 24.7 | 24.7 | 35.8 | 35.8 |
| CapnProto:capnproto-1.0.2 | 13.9 | 14.1 | 23.2 | 23.5 |
| FlatBuffers:24.3.25 | 3.93 | 3.98 | 14.7 | 14.6 |
| Foundation.JSONEncoder:Foundation | 19.2 | 19.4 | 33.2 | 33.1 |
| Foundation.PropertyListEncoder:Foundation | 30.6 | 31 | 47 | 47.2 |
| IkigaJSON:2.5.3 | 18.6 | 18.7 | 32.4 | 32.4 |
| SwiftAvroCore:2.3.0 | 46.6 | 46.7 | 53.7 | 54.1 |
| SwiftBSON:3.1.0 | 34.1 | 34.3 | 47.2 | 47.3 |
| SwiftCbor:0.0.4 | 26.3 | 26.5 | 38.2 | 38.1 |
| SwiftMsgpack:1.2.1 | 24.4 | 24.4 | 35.8 | 35.9 |
| SwiftProtobuf:1.38.1 | 3.36 | 3.41 | 9.54 | 9.55 |
| TOML:2.0.0 | 60.2 | 60.2 | 75.8 | 76 |
| XMLCoder:0.18.2 | 135 | 135 | 157 | 157 |
| Yams:5.4.0 | 132 | 132 | 147 | 147 |
Ops/Sec
| serializer | Document · 1 instance | Document · 100 instances | Event · 1 instance | Event · 100 instances | Message · 1 instance | Message · 100 instances | Strings · 1 instance | Strings · 100 instances | Telemetry · 1 instance | Telemetry · 100 instances |
|---|---|---|---|---|---|---|---|---|---|---|
| BinaryCodable:4.0.0 | 13K | 0.18K | 23K | 0.37K | 40K | 0.78K | 27K | 0.4K | 32K | 0.64K |
| CapnProto:capnproto-1.0.2 | 39K | 1.1K | 41K | 1.3K | 72K | 7.2K | 32K | 0.62K | 51K | 2.3K |
| FlatBuffers:24.3.25 | 130K | 4.1K | 110K | 4.8K | 250K | 16K | 98K | 2K | 140K | 8.2K |
| Foundation.JSONEncoder:Foundation | 19K | 0.32K | 33K | 0.73K | 52K | 1.5K | 28K | 0.43K | 20K | 0.31K |
| Foundation.PropertyListEncoder:Foundation | 11K | 0.16K | 19K | 0.32K | 33K | 0.76K | 14K | 0.18K | 13K | 0.17K |
| IkigaJSON:2.5.3 | 20K | 0.3K | 34K | 0.66K | 54K | 1.3K | 31K | 0.46K | 22K | 0.32K |
| SwiftAvroCore:2.3.0 | 7.4K | 0.1K | 13K | 0.21K | 21K | 0.4K | 23K | 0.45K | 18K | 0.35K |
| SwiftBSON:3.1.0 | 9.5K | 0.13K | 15K | 0.24K | 29K | 0.54K | 11K | 0.13K | 8.7K | 0.11K |
| SwiftCbor:0.0.4 | 11K | 0.16K | 21K | 0.33K | 38K | 0.78K | 17K | 0.22K | 17K | 0.23K |
| SwiftMsgpack:1.2.1 | 13K | 0.18K | 22K | 0.36K | 41K | 0.88K | 19K | 0.23K | 16K | 0.22K |
| SwiftProtobuf:1.38.1 | 110K | 3.1K | 140K | 4.5K | 300K | 19K | 200K | 5K | 240K | 15K |
| TOML:2.0.0 | 5.3K | 0.054K | 9.8K | 0.11K | 17K | 0.25K | 14K | 0.19K | 9.5K | 0.13K |
| XMLCoder:0.18.2 | 2.5K | 0.03K | 4.7K | 0.065K | 7.4K | 0.11K | 2.7K | 0.031K | 2K | 0.023K |
| Yams:5.4.0 | 2.5K | 0.03K | 4.3K | 0.06K | 7.6K | 0.11K | 3.3K | 0.039K | 2.2K | 0.025K |
Latency distributions
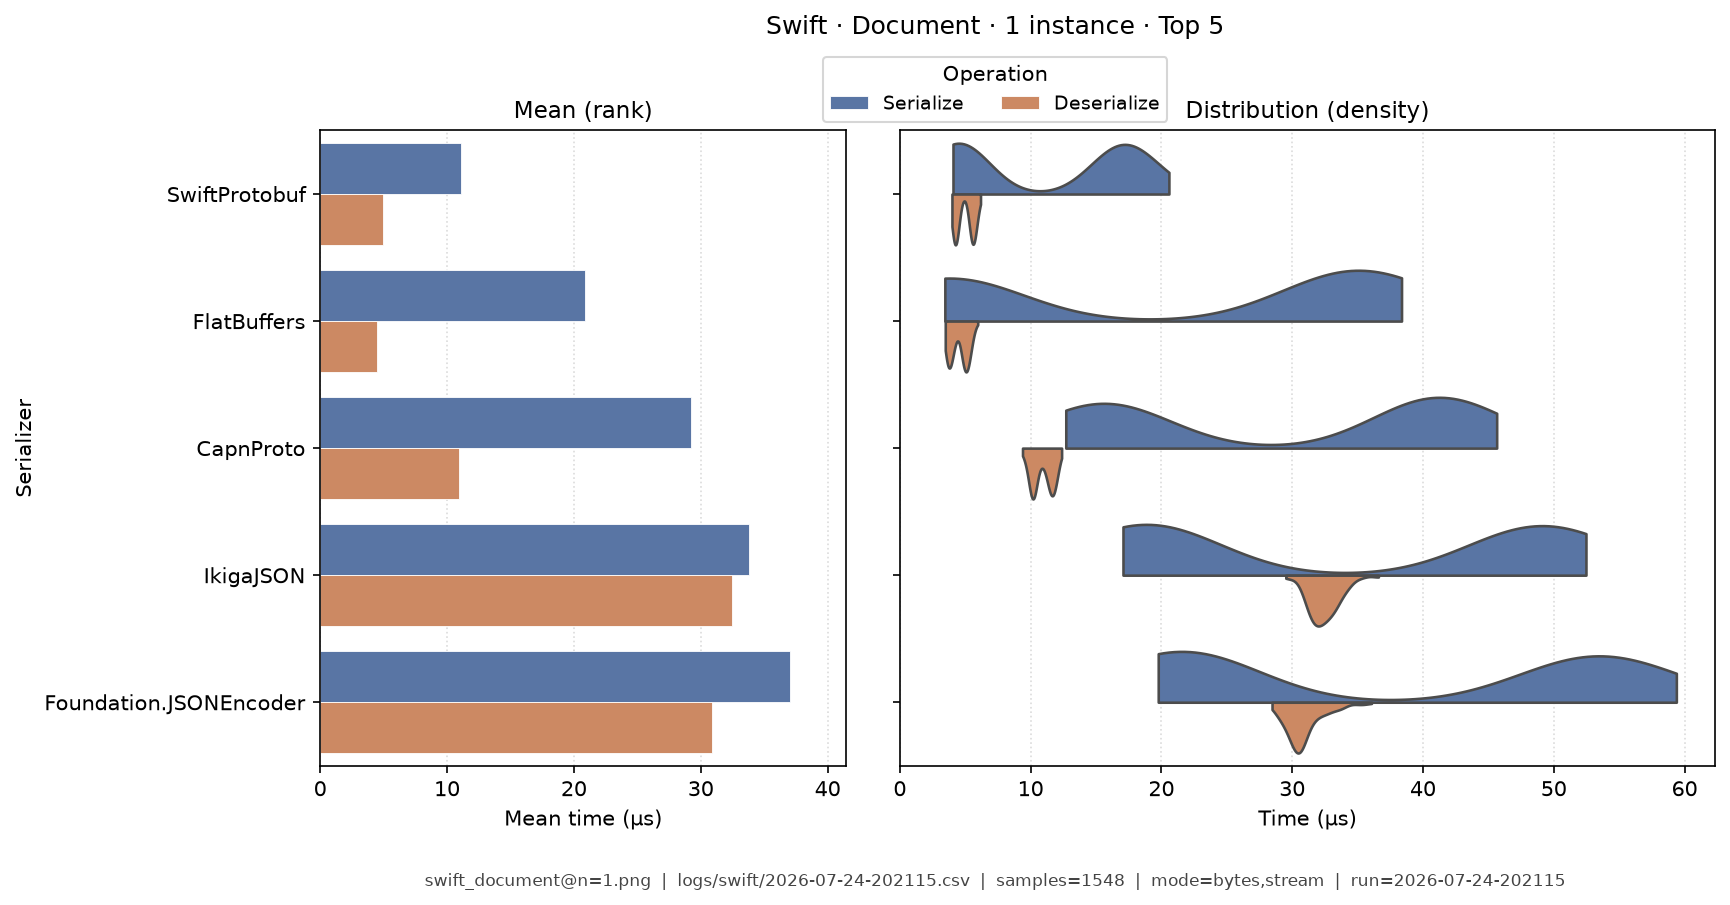
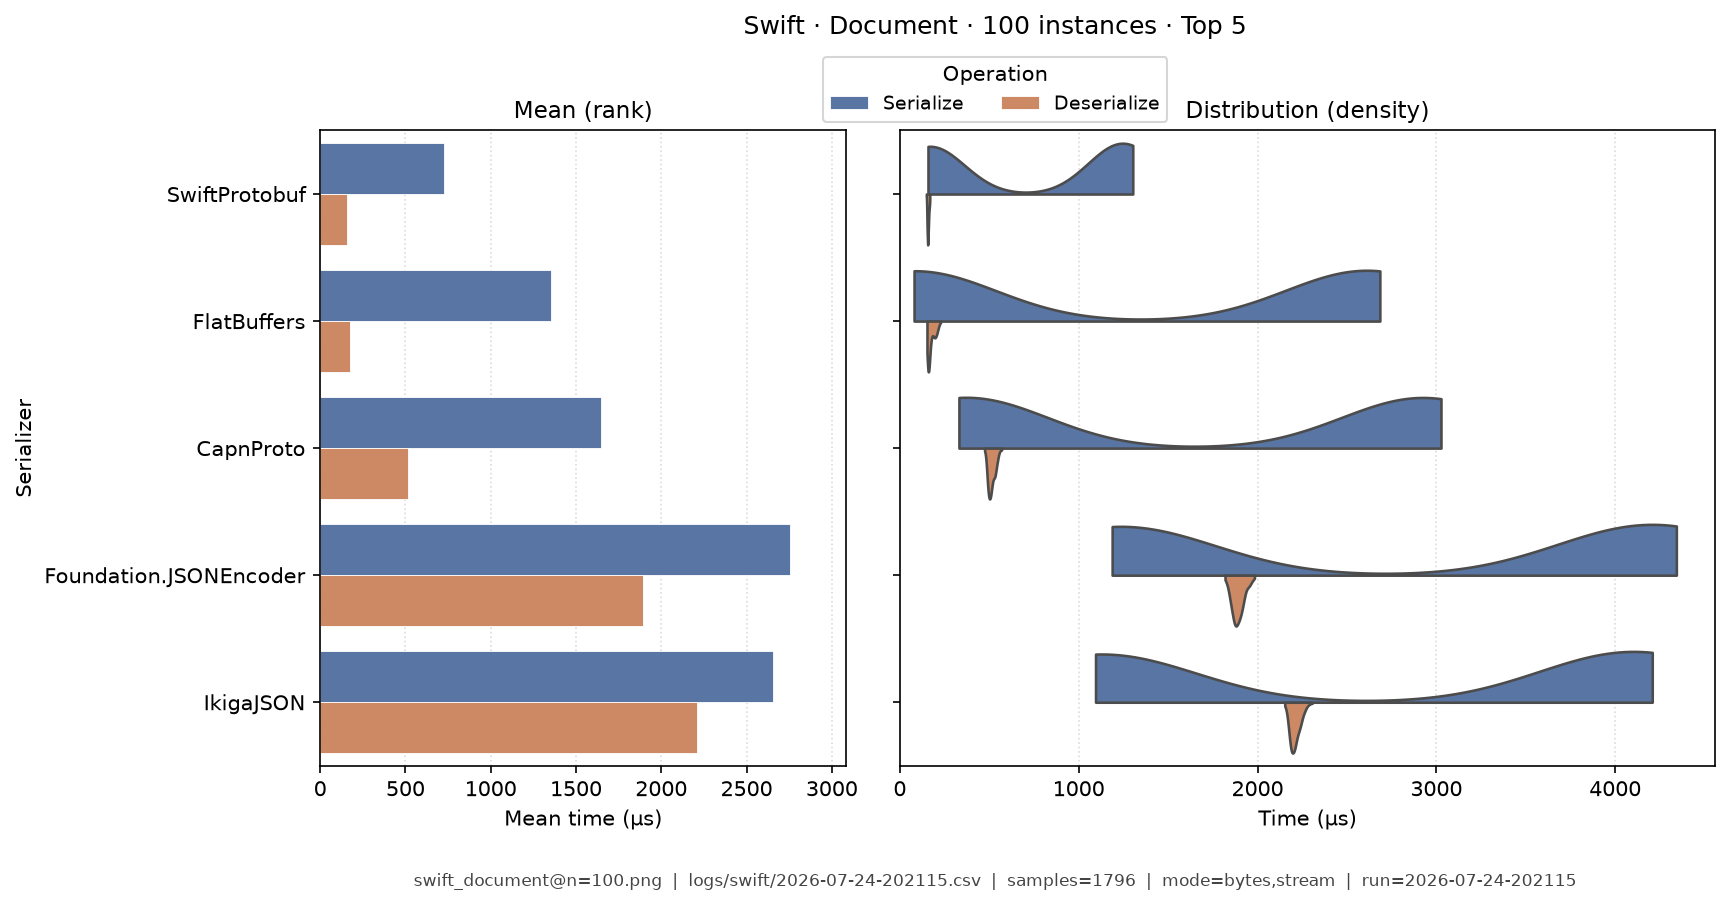
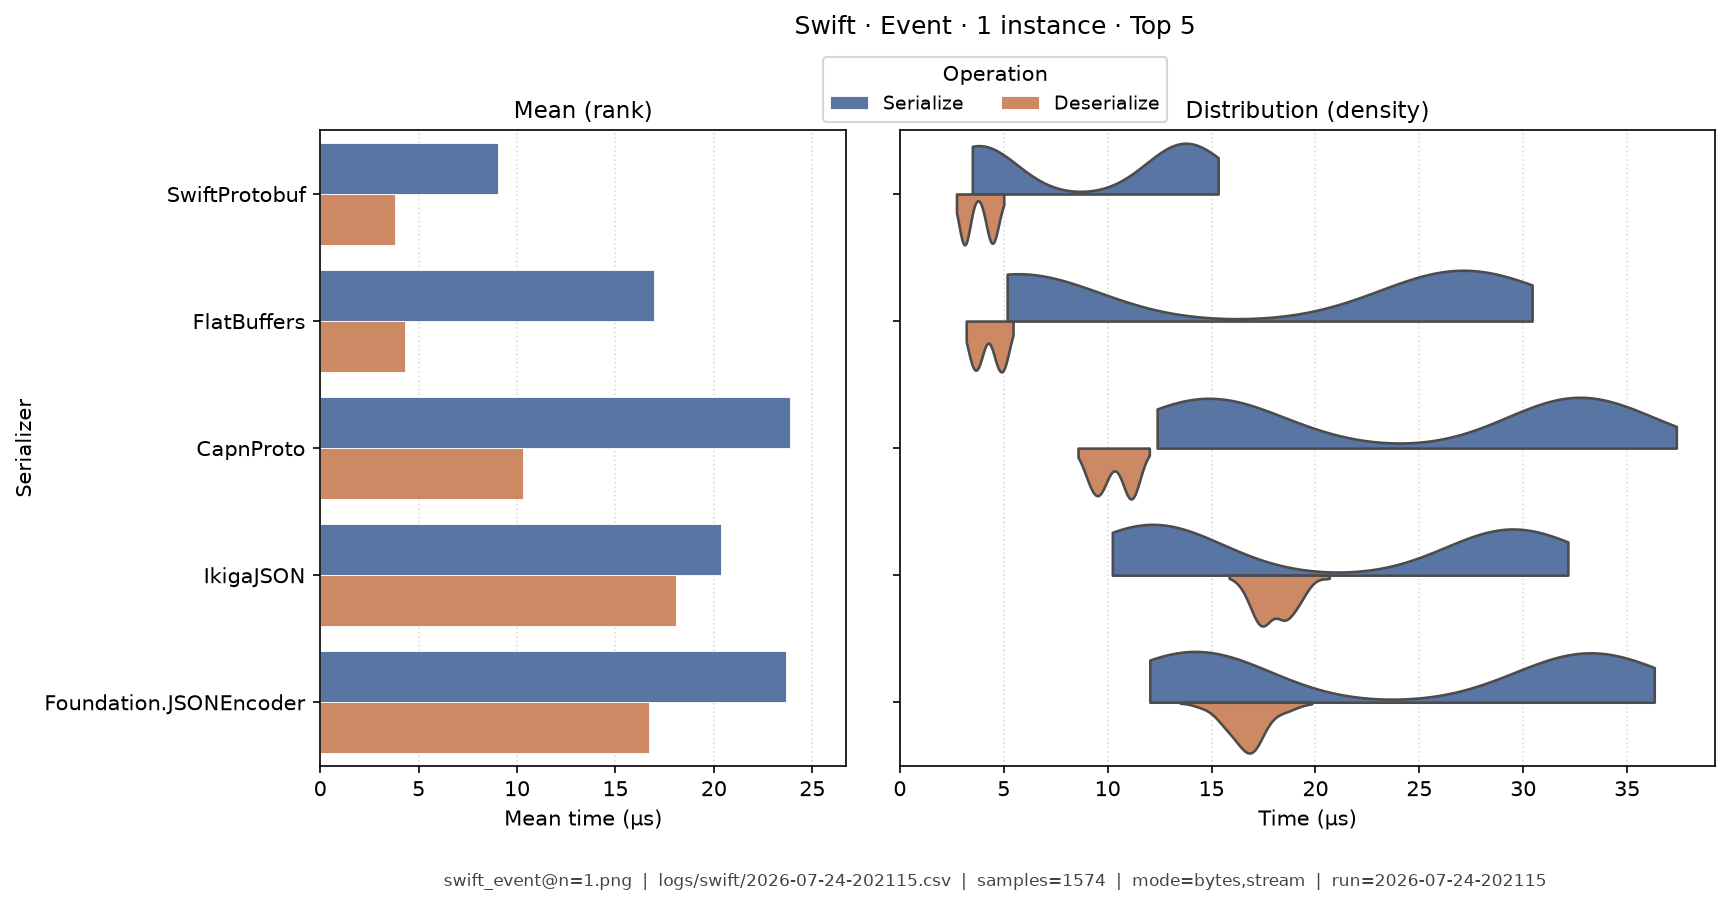
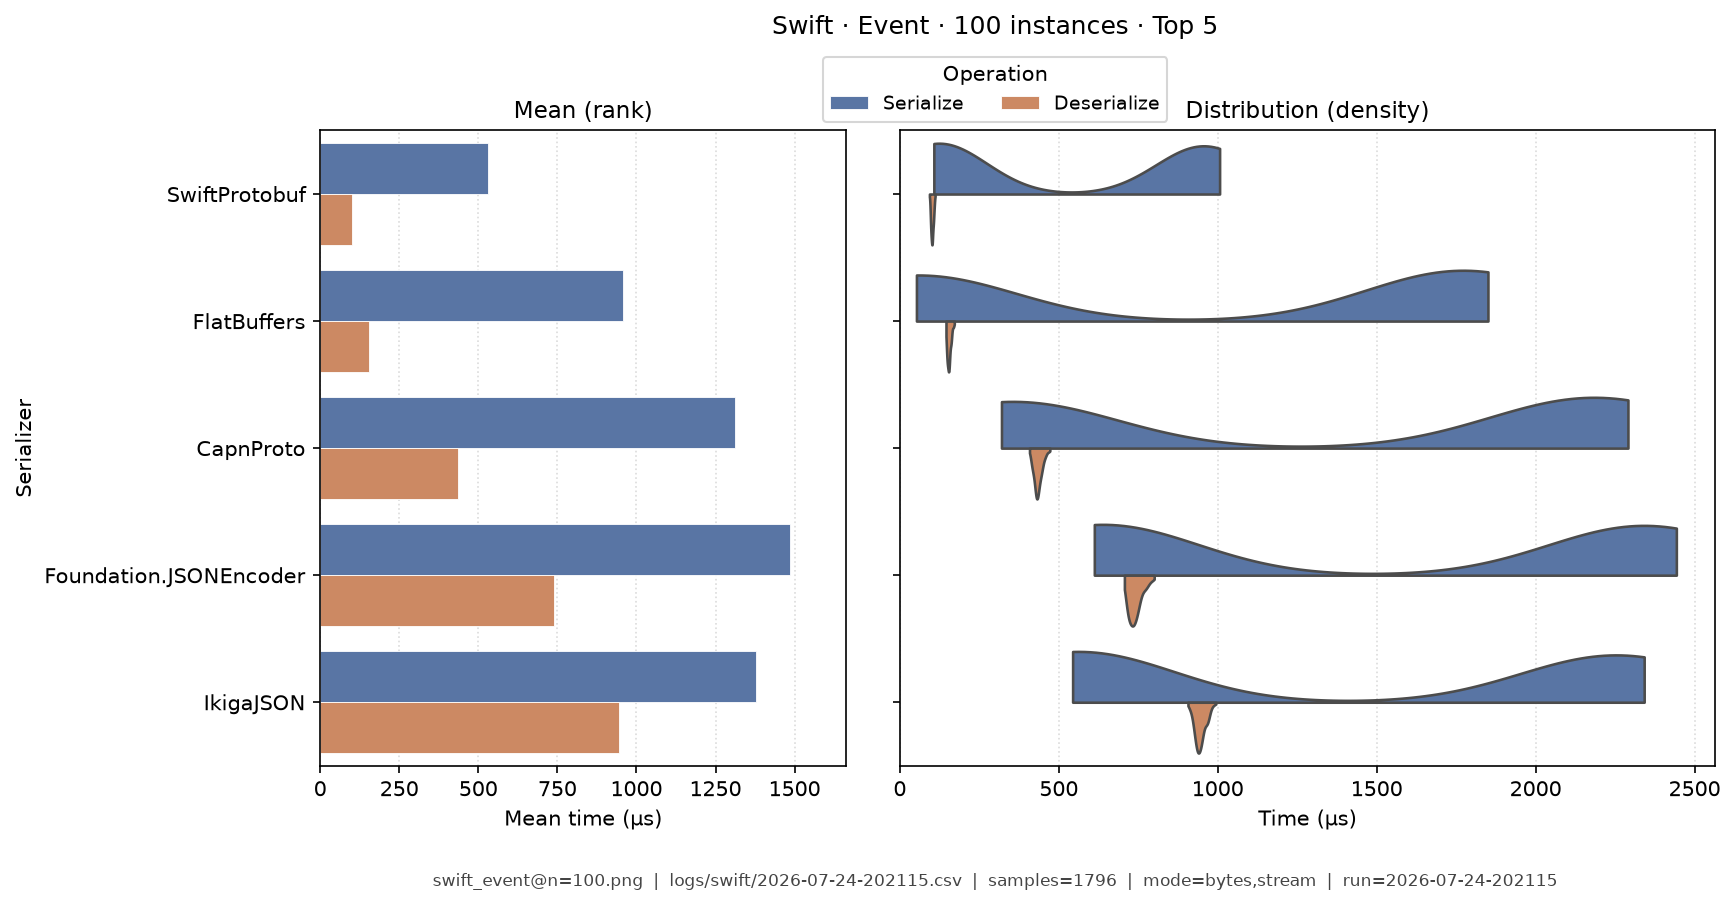
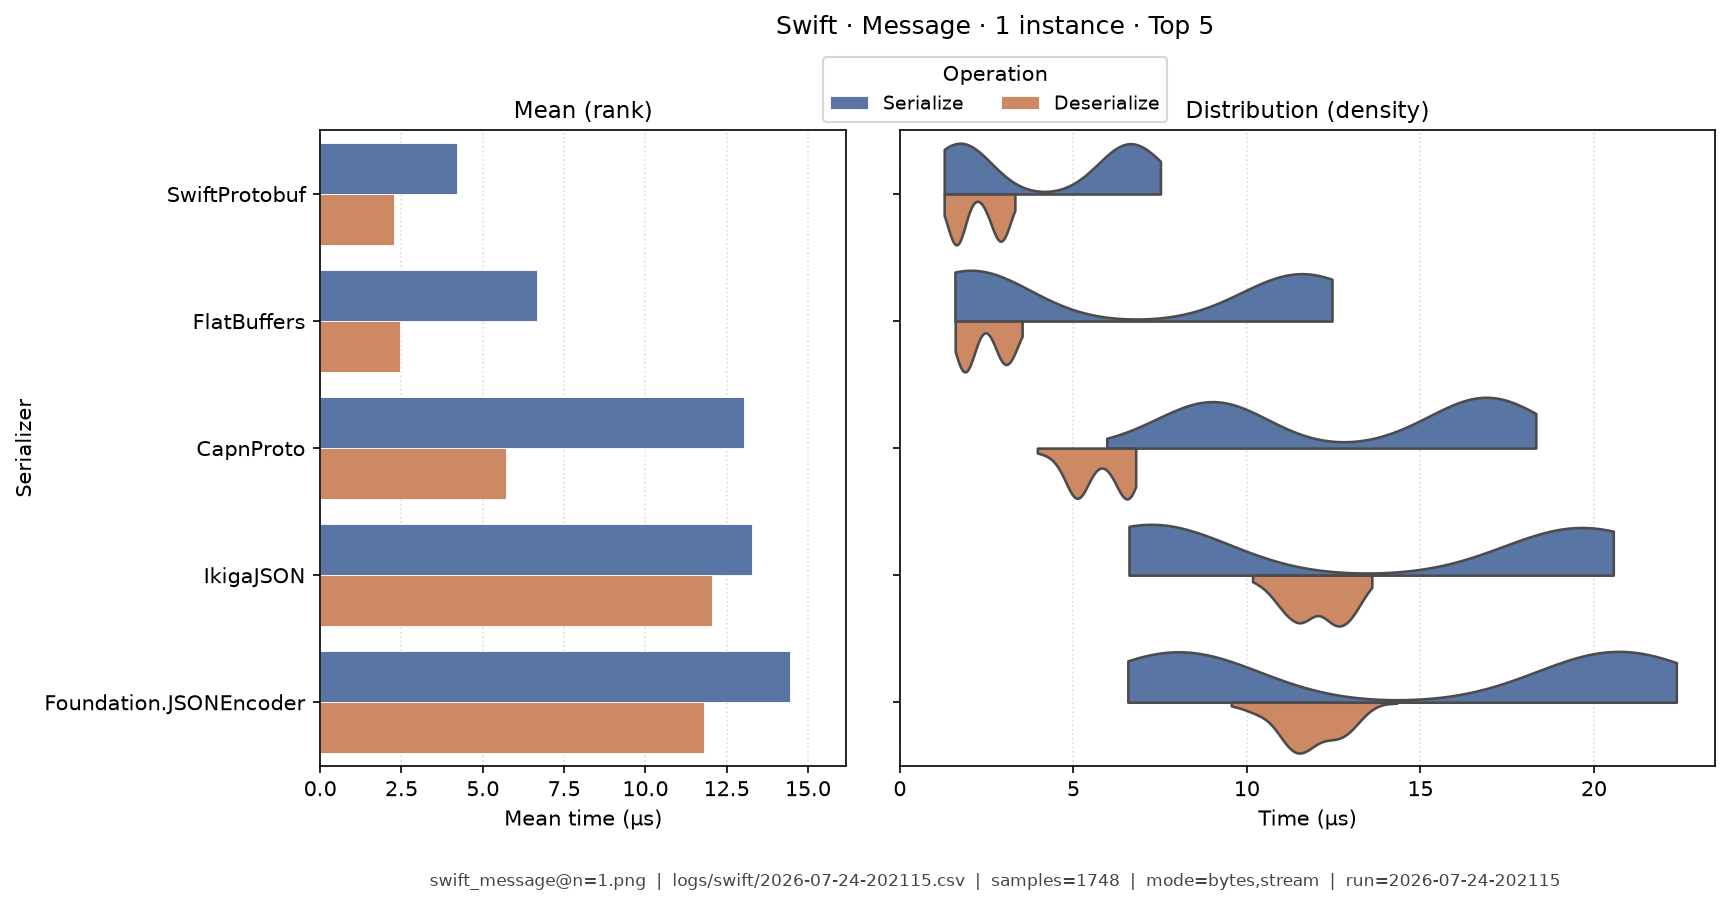
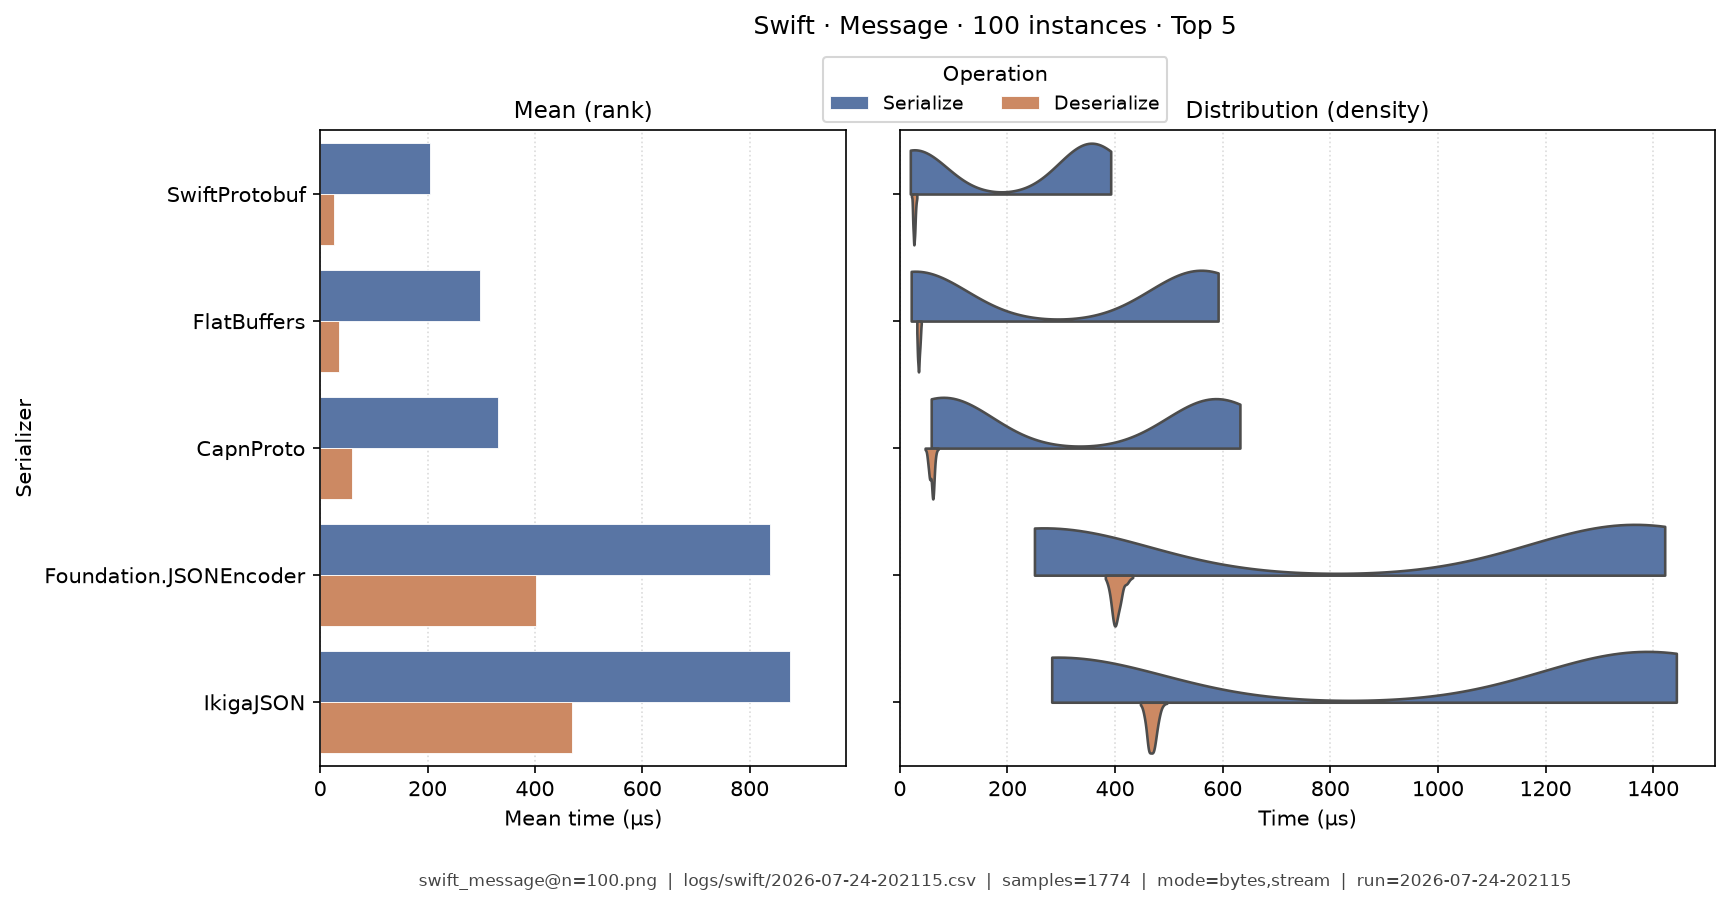
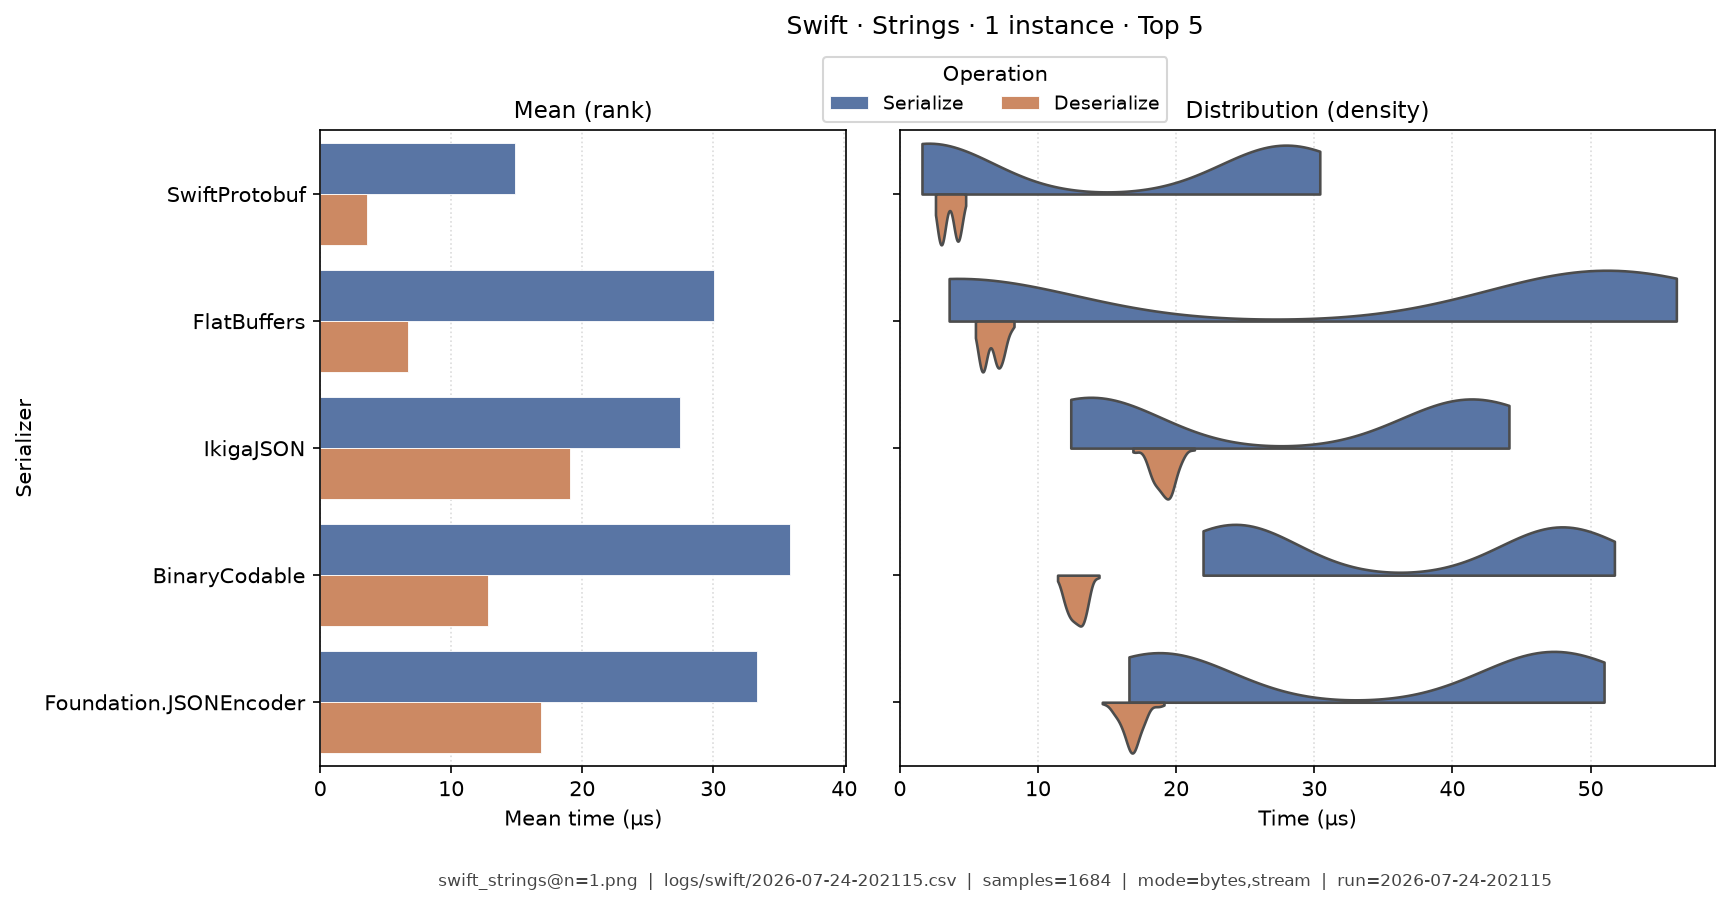
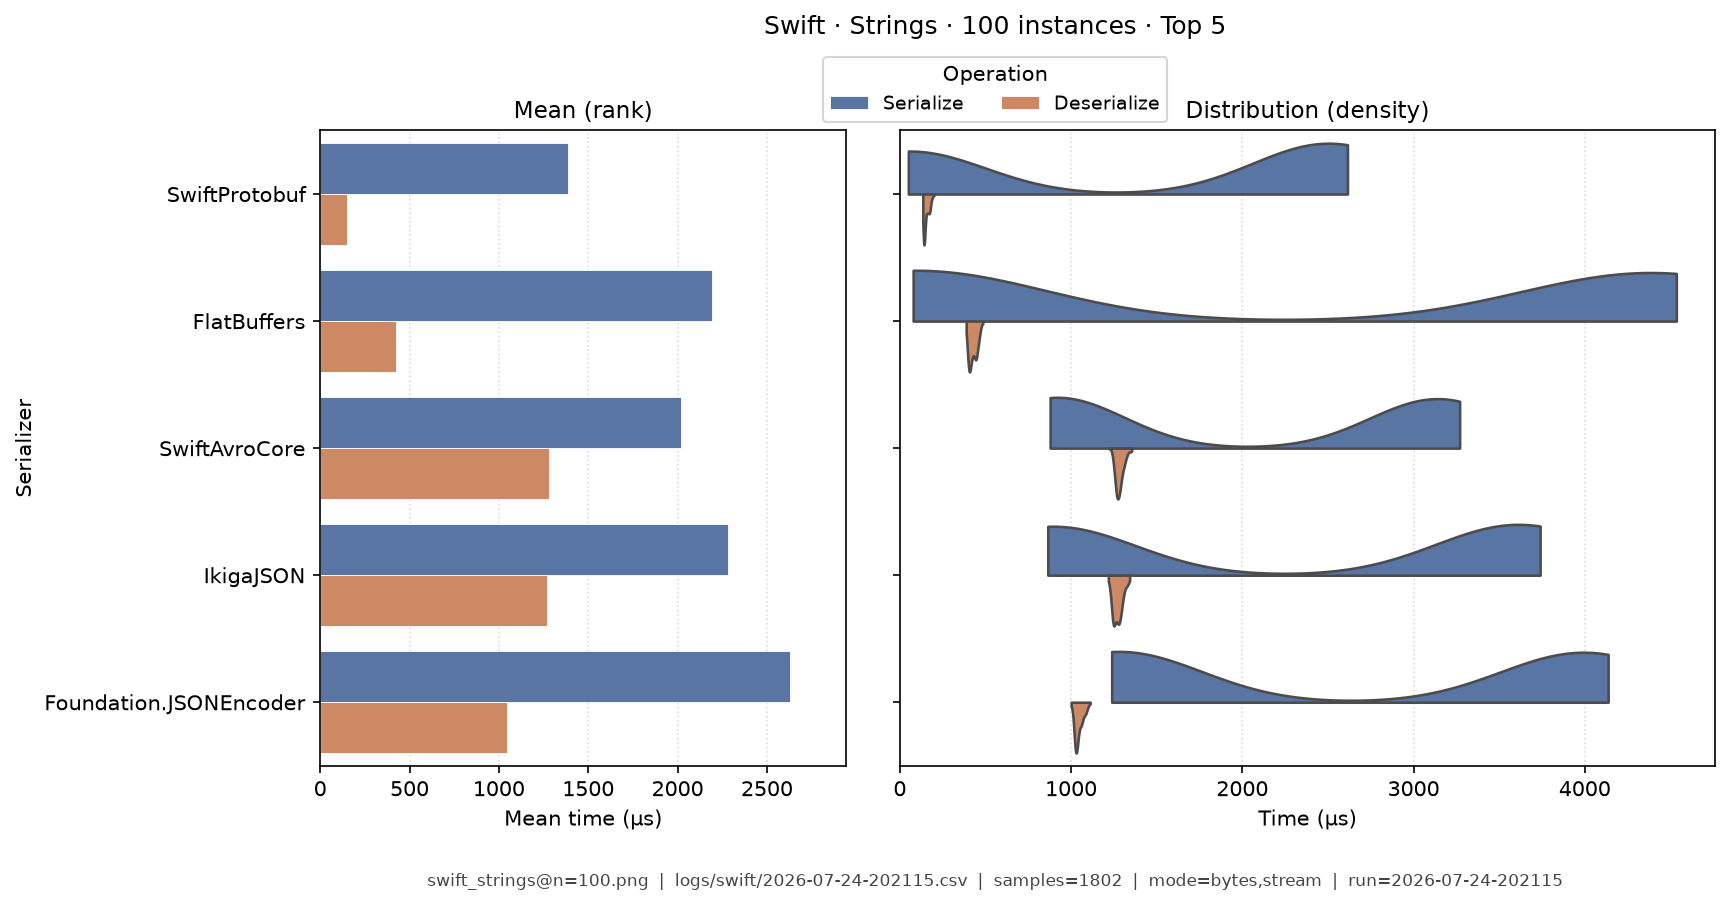
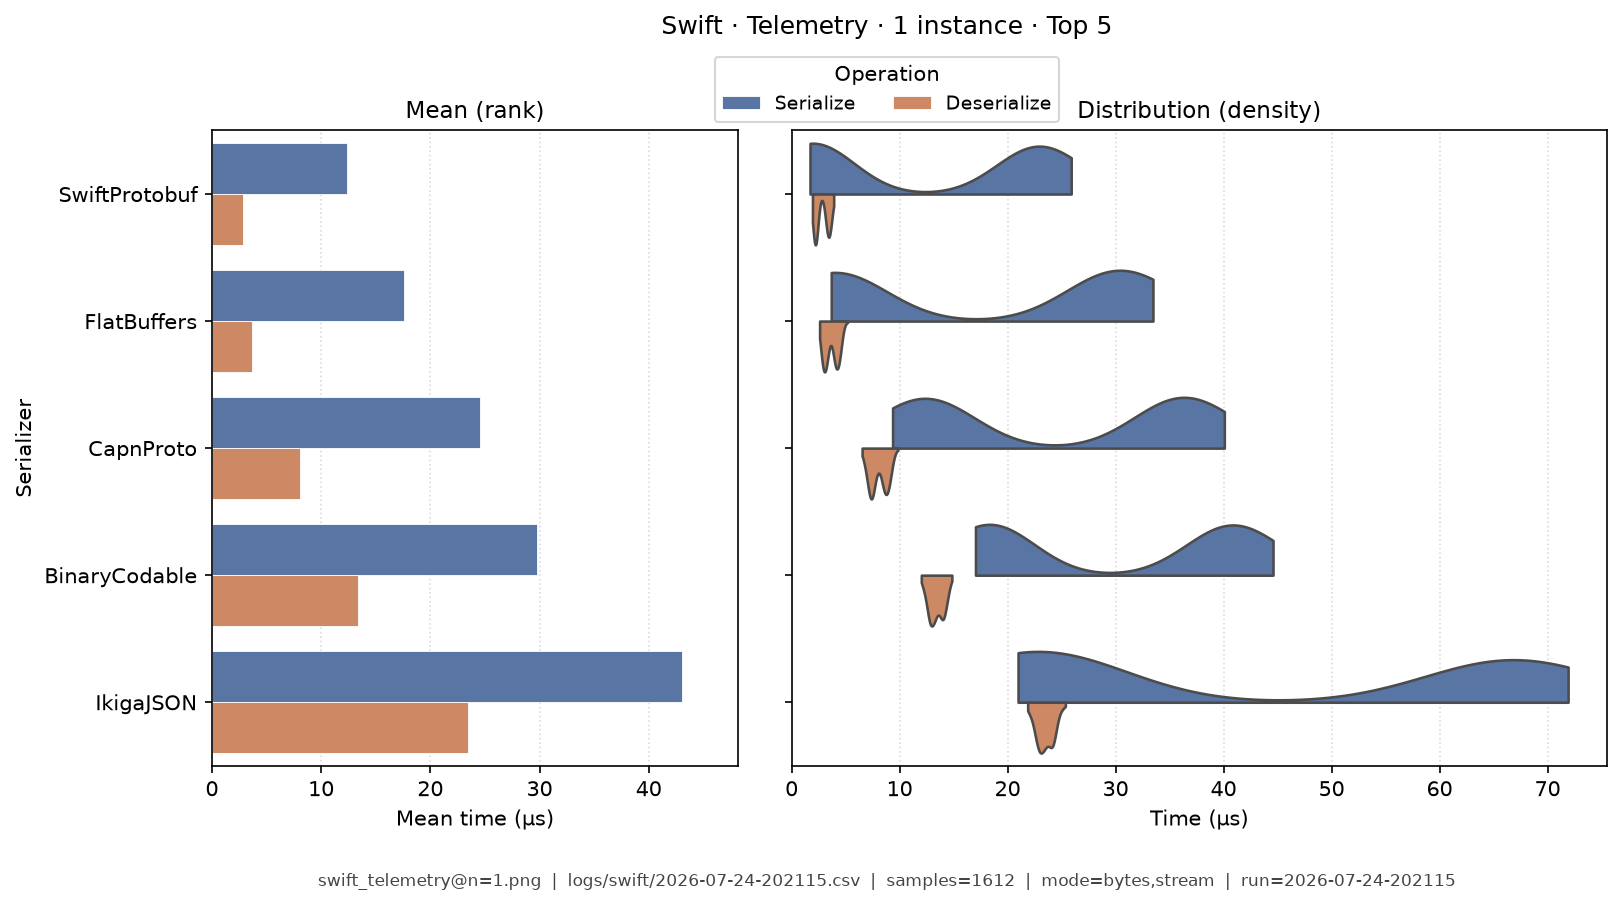
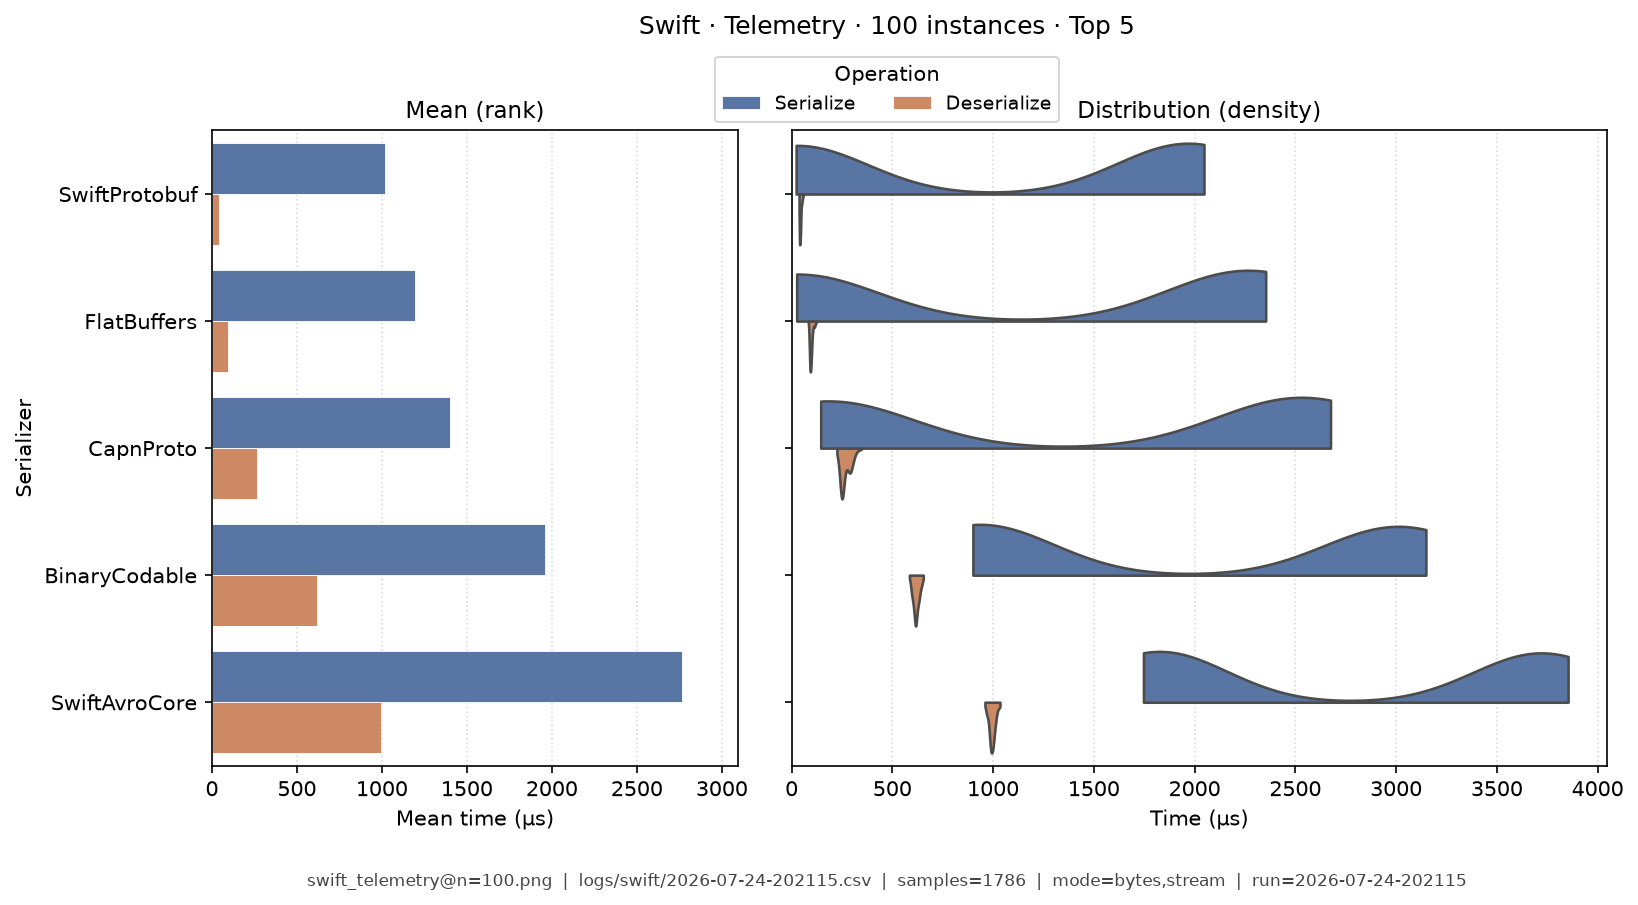
Each figure is a picture of how long serialize and deserialize took across many trials for one data type (and batch size):
- Left — mean bars: average serialize time and average deserialize time in microseconds (scale starts at 0).
- Right — split violins: the full distribution of sample times (thickness shows where trials cluster).
- Top 5 only: charts show the five fastest serializers by mean total time for that data type so the picture stays readable. Tables above still list everyone.
- Each image also prints the data type, source CSV, modes, and sample size.
Document · 1 instance
Document · 100 instances
Event · 1 instance
Event · 100 instances
Message · 1 instance
Message · 100 instances
Strings · 1 instance
Strings · 100 instances
Telemetry · 1 instance
Telemetry · 100 instances
How to regenerate this page
Snapshots are produced on a developer machine. After a benchmark-runner run (each run writes a timestamped YYYY-MM-DD-HHMMSS.csv):
analyze-benchmarks              # all languages
analyze-benchmarks -l swift   # this language only
That refreshes this language’s tables and the latency images under docs/analysis/plots/violin/. The hub Results summary is a static link index and is not rewritten by the CLI. Commit updated results.md and plot files when you want them on the site.
Run configuration (important)
Show host, seed, serializers, and source CSV
These fields come from the run sidecar next to the CSV (*.configs.json, or older *.environment.json files). They describe the machine and the run setup, not the timing formulas. For metric definitions, see the Metrics catalog. Optional blocks (dataset, serializers) appear only when the benchmark runner recorded them.
- Source CSV:
logs/swift/2026-07-24-202115.csv - run=2026-07-24-202115
- language=swift
- os=Linux 6.8.0-124-generic
- cpu=12th Gen Intel(R) Core(TM) i7-12800H (20 threads)
- ram=31.0 GiB
- runtimes: python=3.14.0, node=24.15.0, dotnet=9.0.316
- git=40f6a8e dirty
- seed=42
- warmup_reps=1
- serializers=14
- metrics_profile=multi_way
- Data types (config): message, document, telemetry, strings, event
- Serializers (from CSV):
BinaryCodable@ 4.0.0CapnProto@ capnproto-1.0.2FlatBuffers@ 24.3.25Foundation.JSONEncoder@ FoundationFoundation.PropertyListEncoder@ FoundationIkigaJSON@ 2.5.3SwiftAvroCore@ 2.3.0SwiftBSON@ 3.1.0SwiftCbor@ 0.0.4SwiftMsgpack@ 1.2.1SwiftProtobuf@ 1.38.1TOML@ 2.0.0XMLCoder@ 0.18.2Yams@ 5.4.0