Performance (Violin Plots)
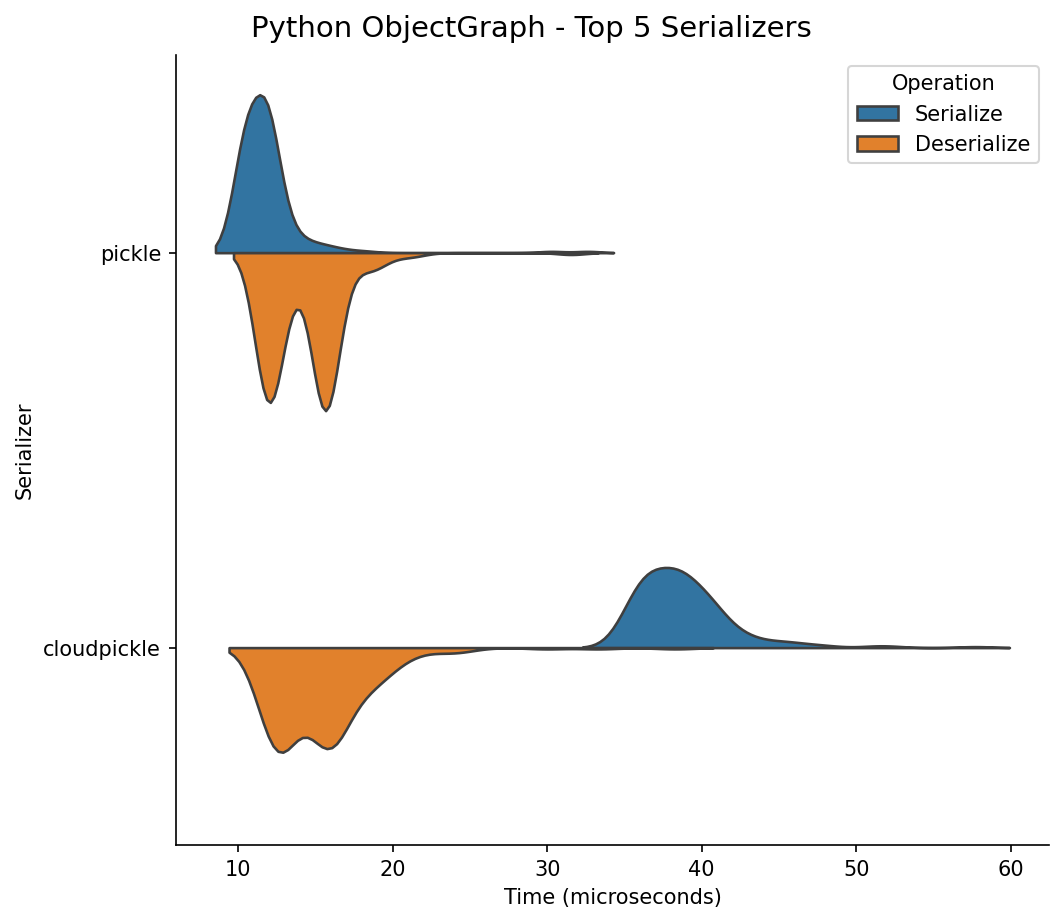
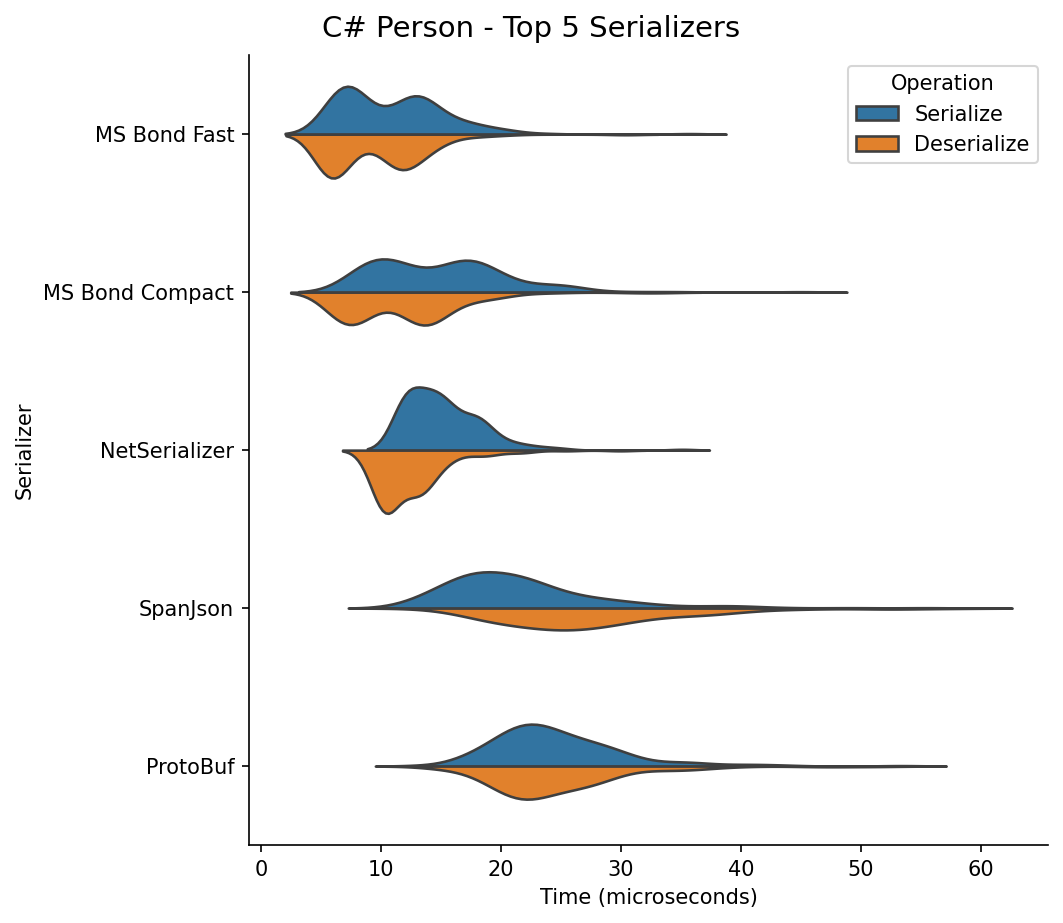
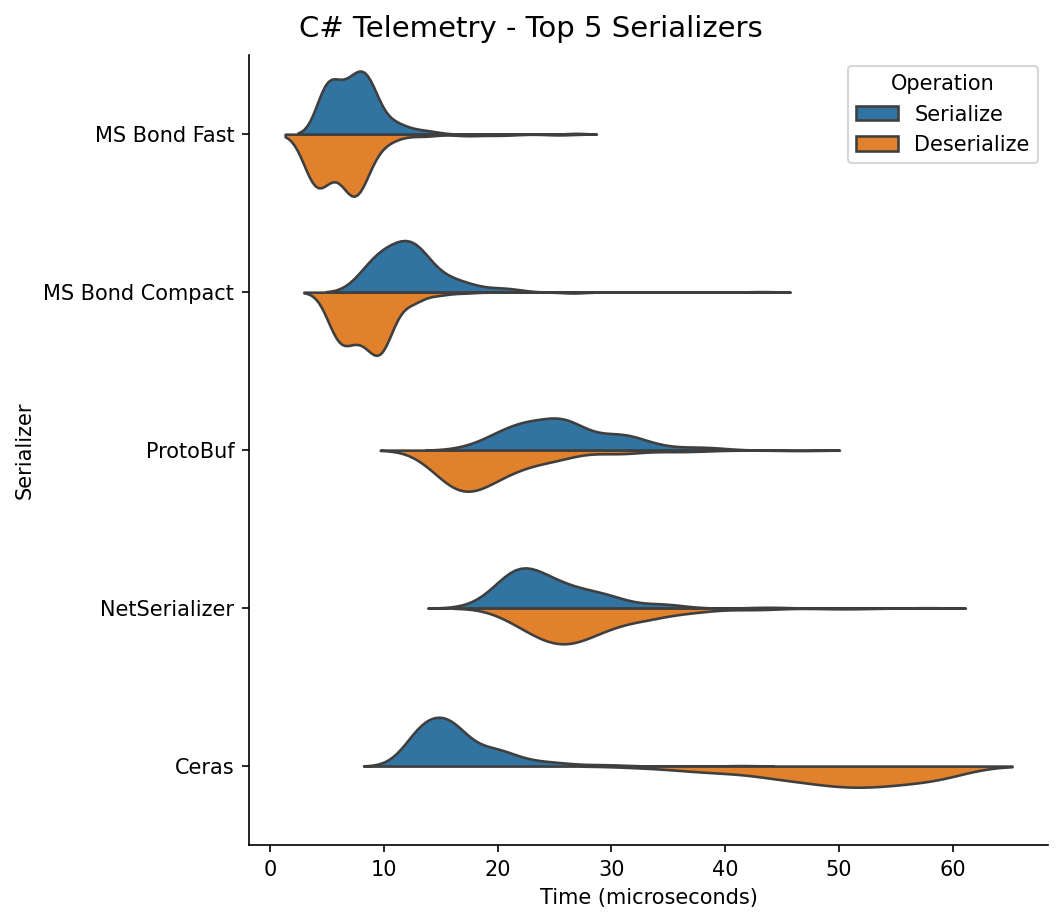
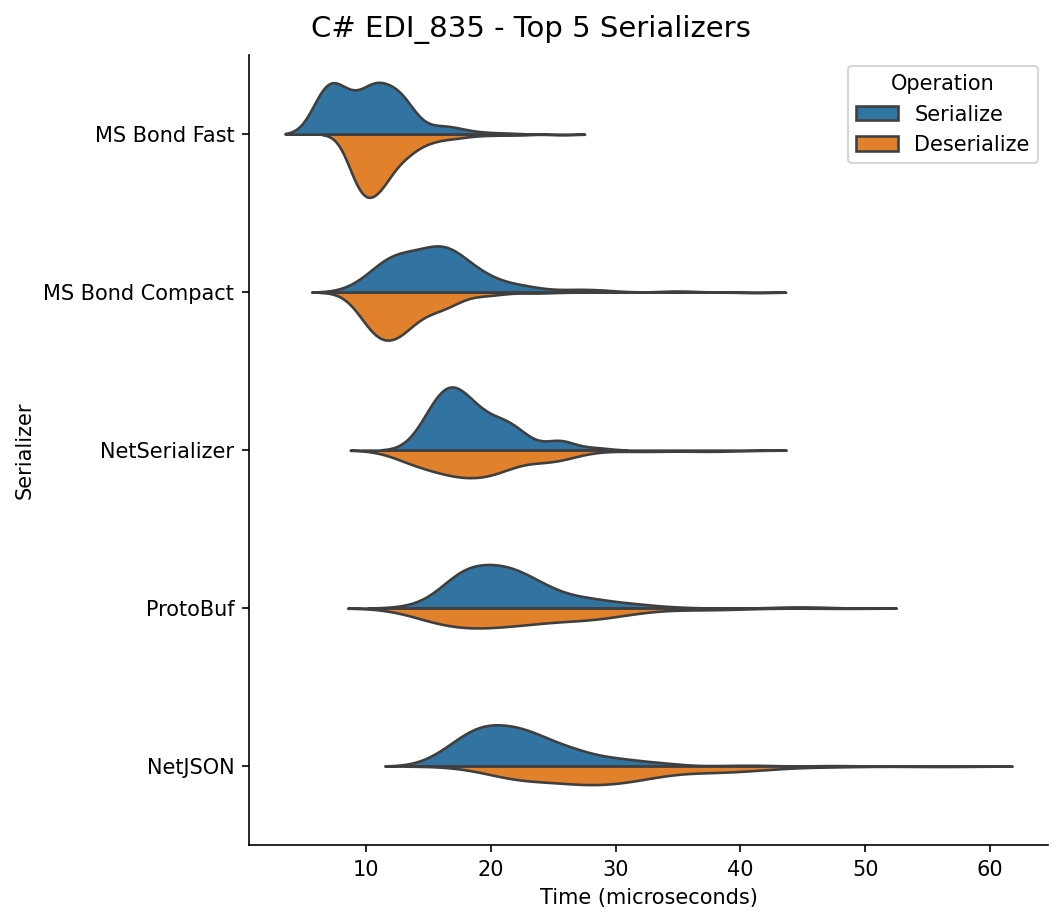
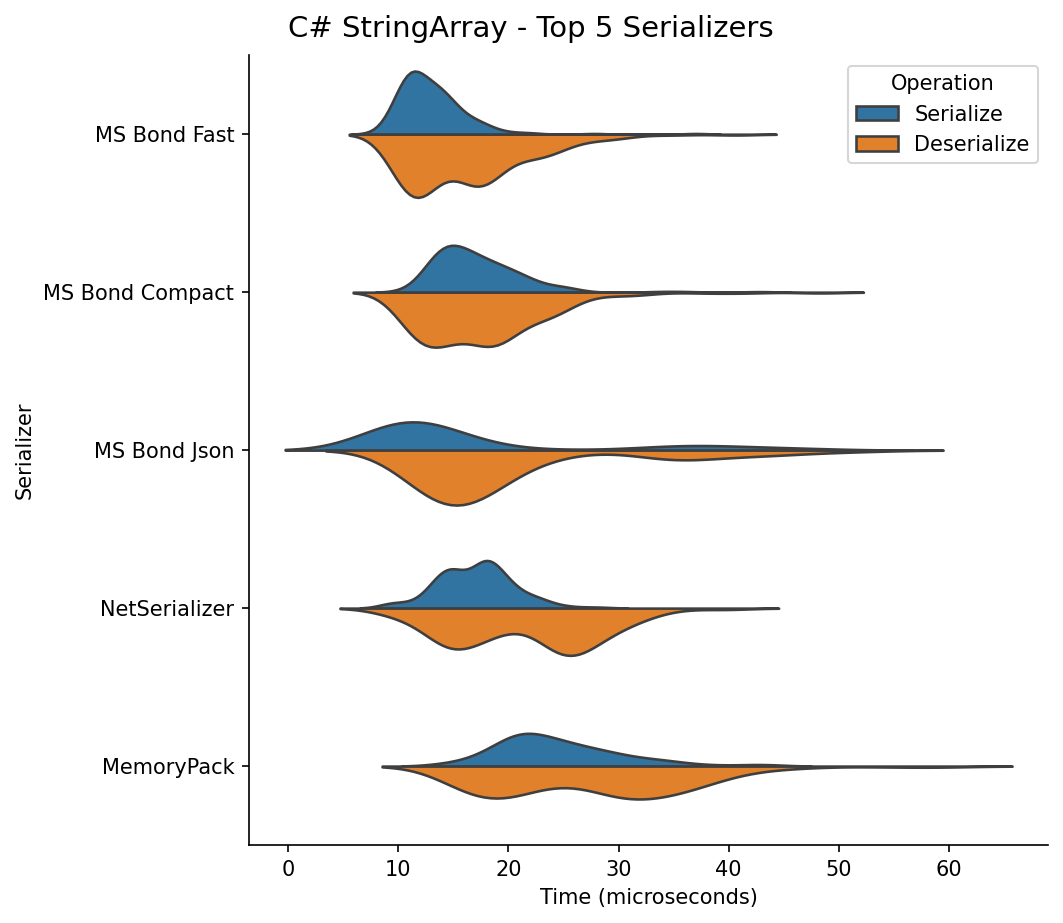
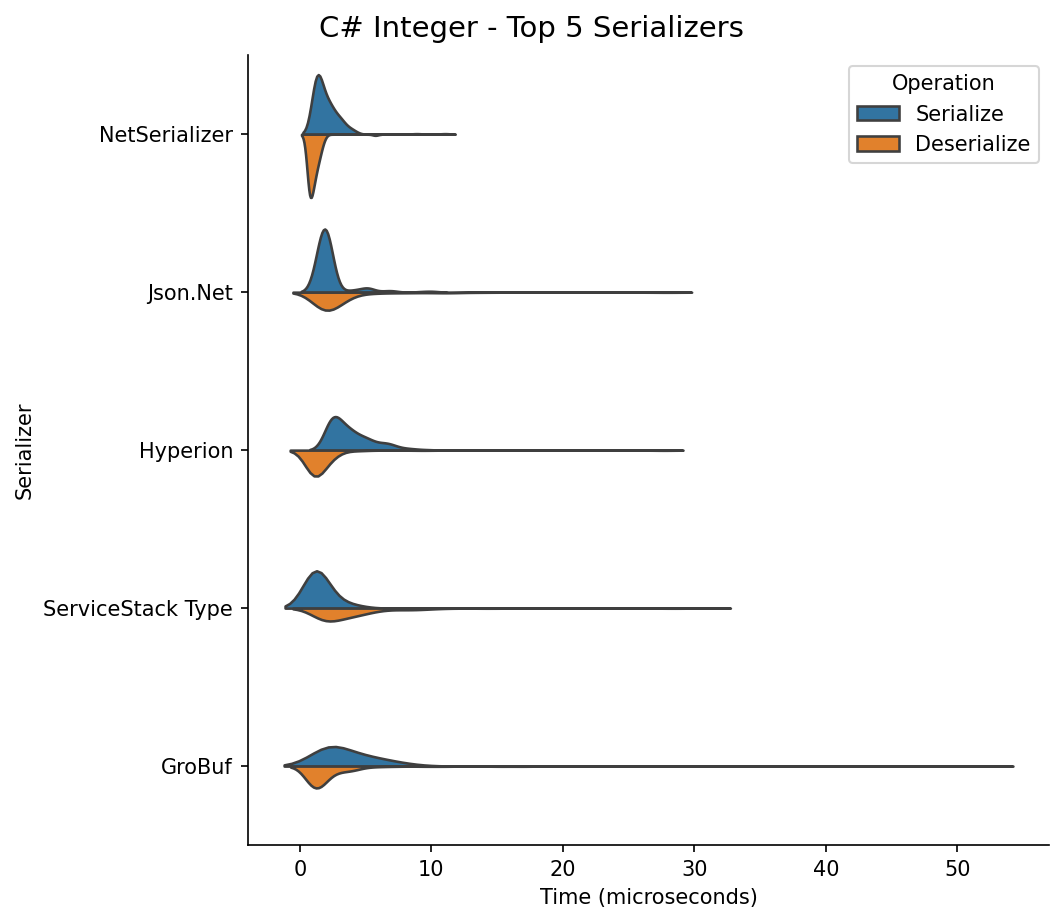
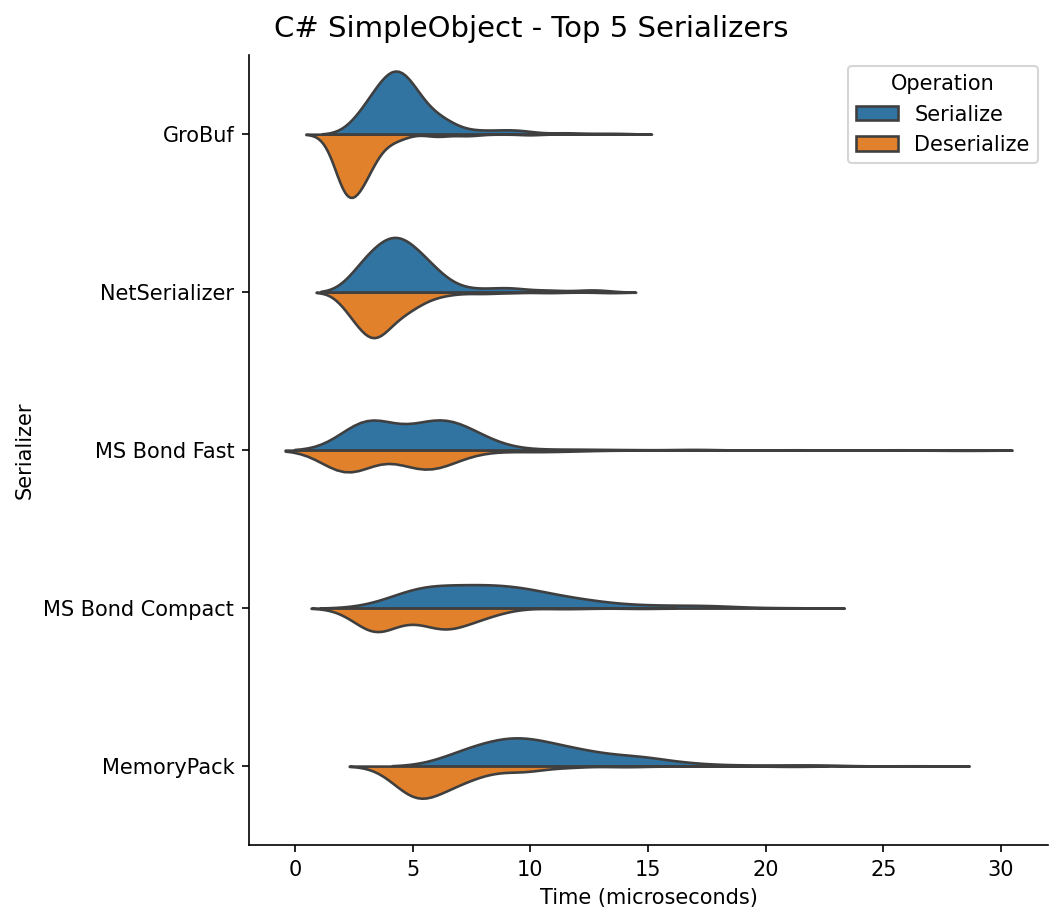
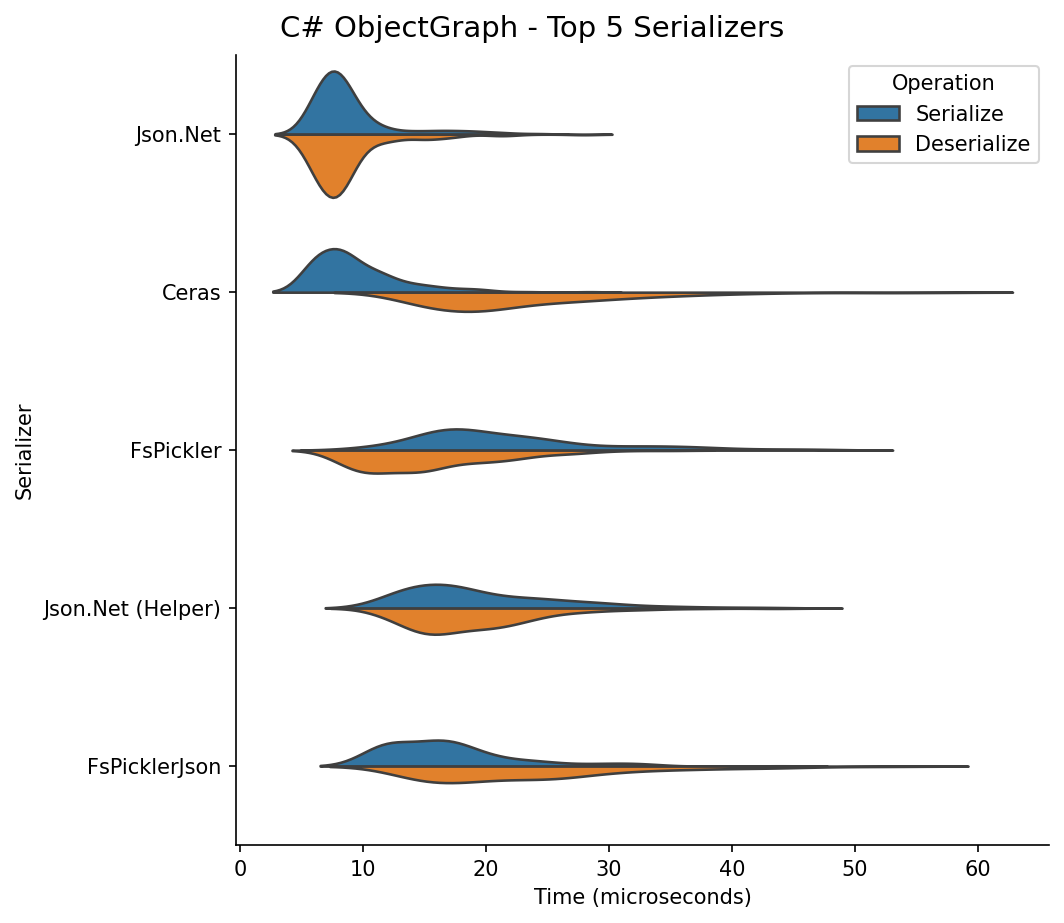
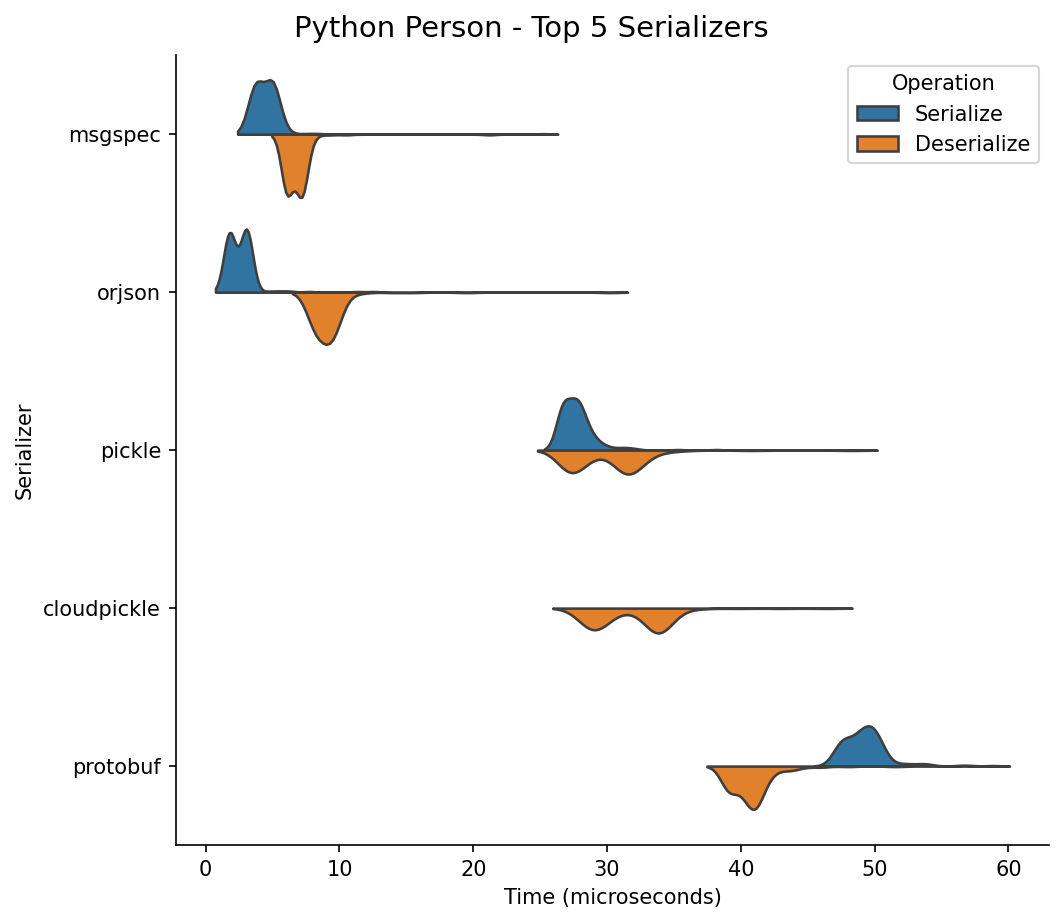
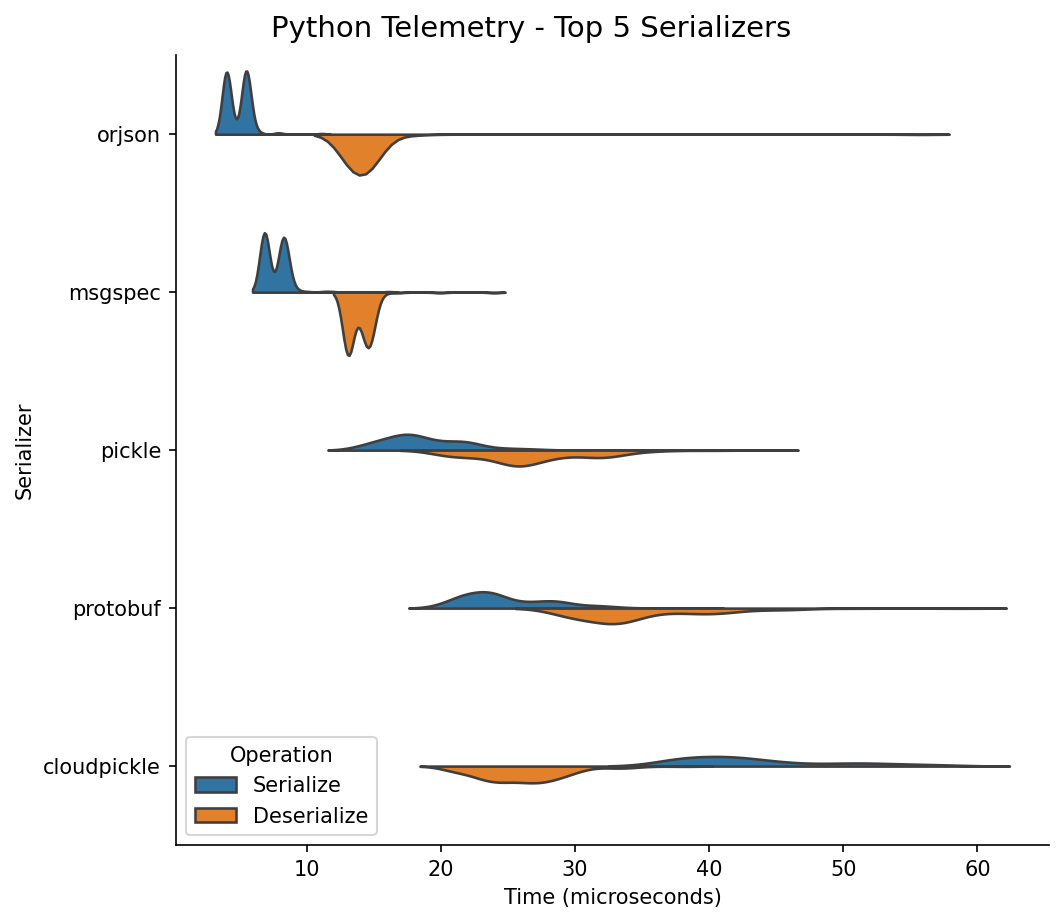
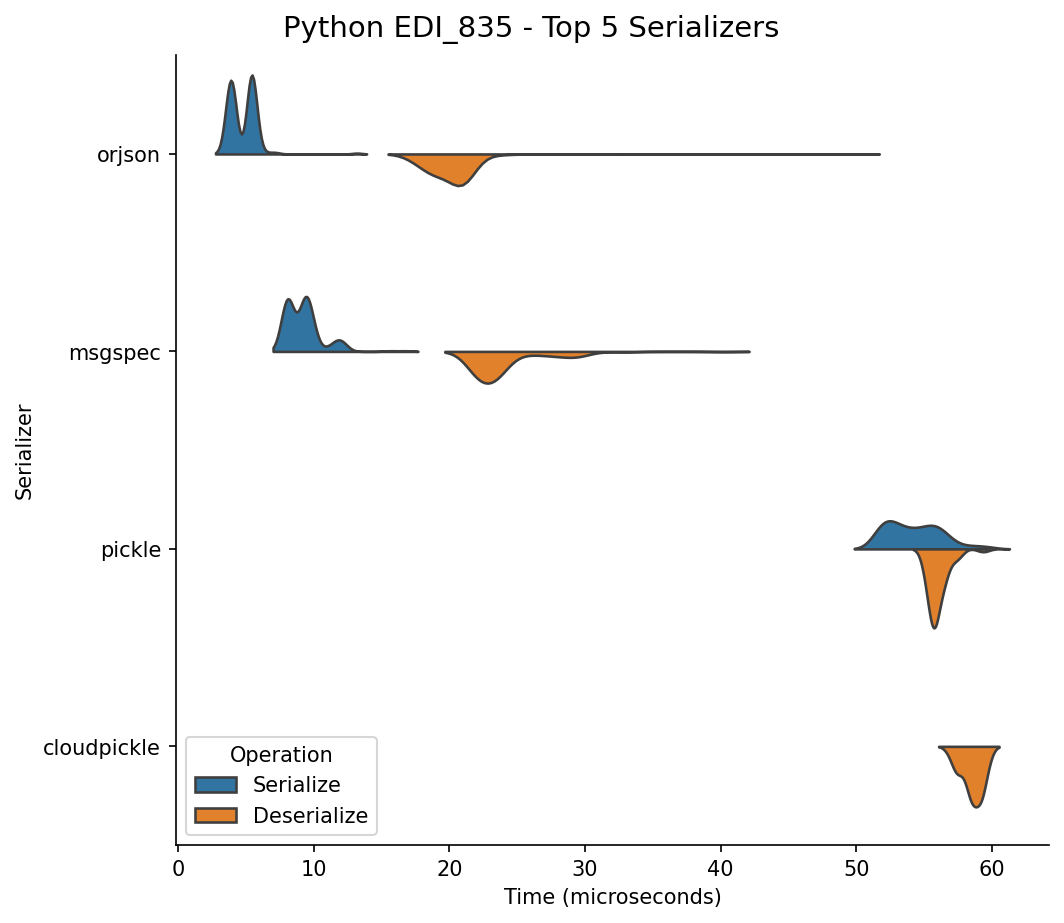
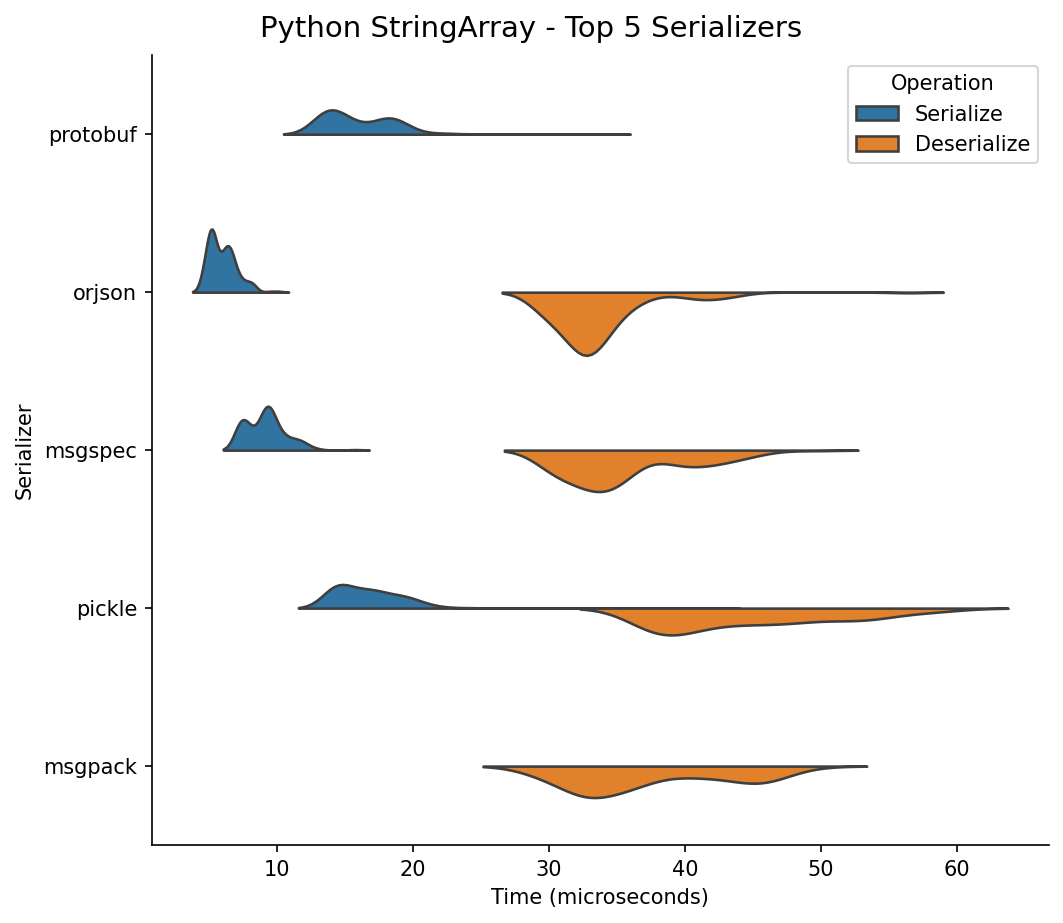
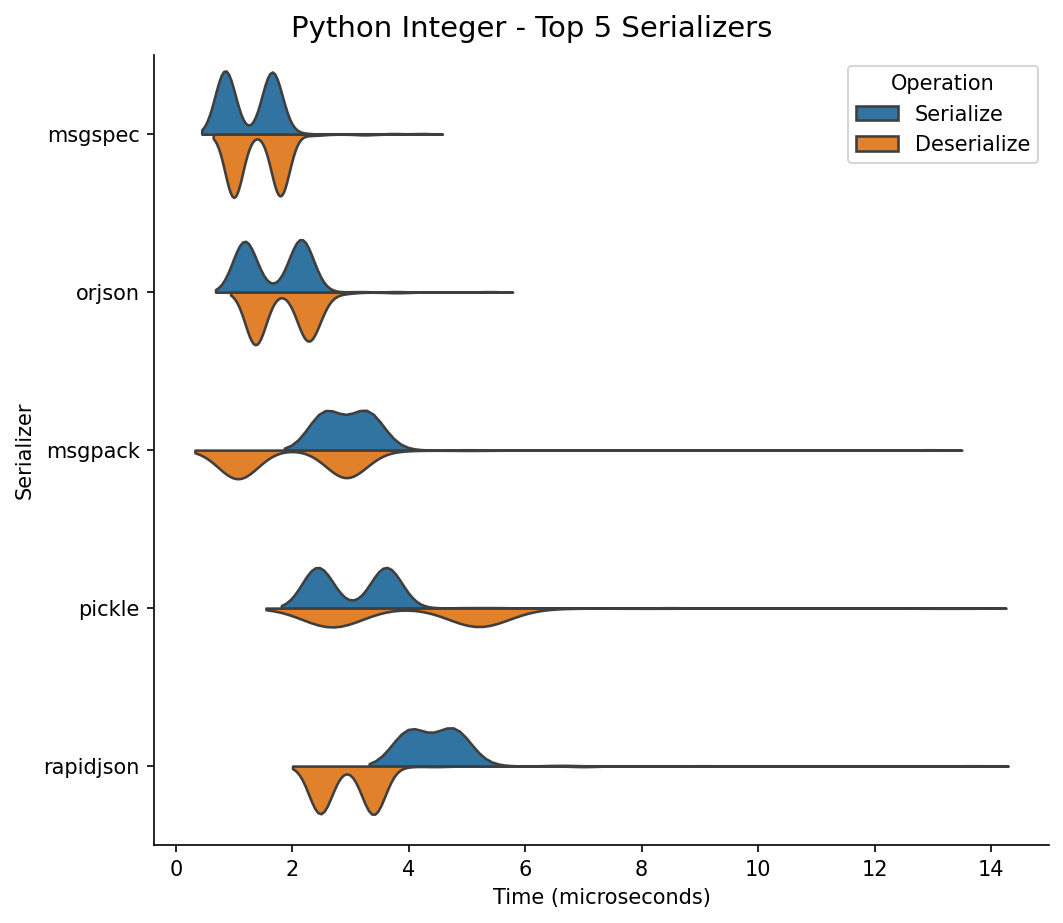
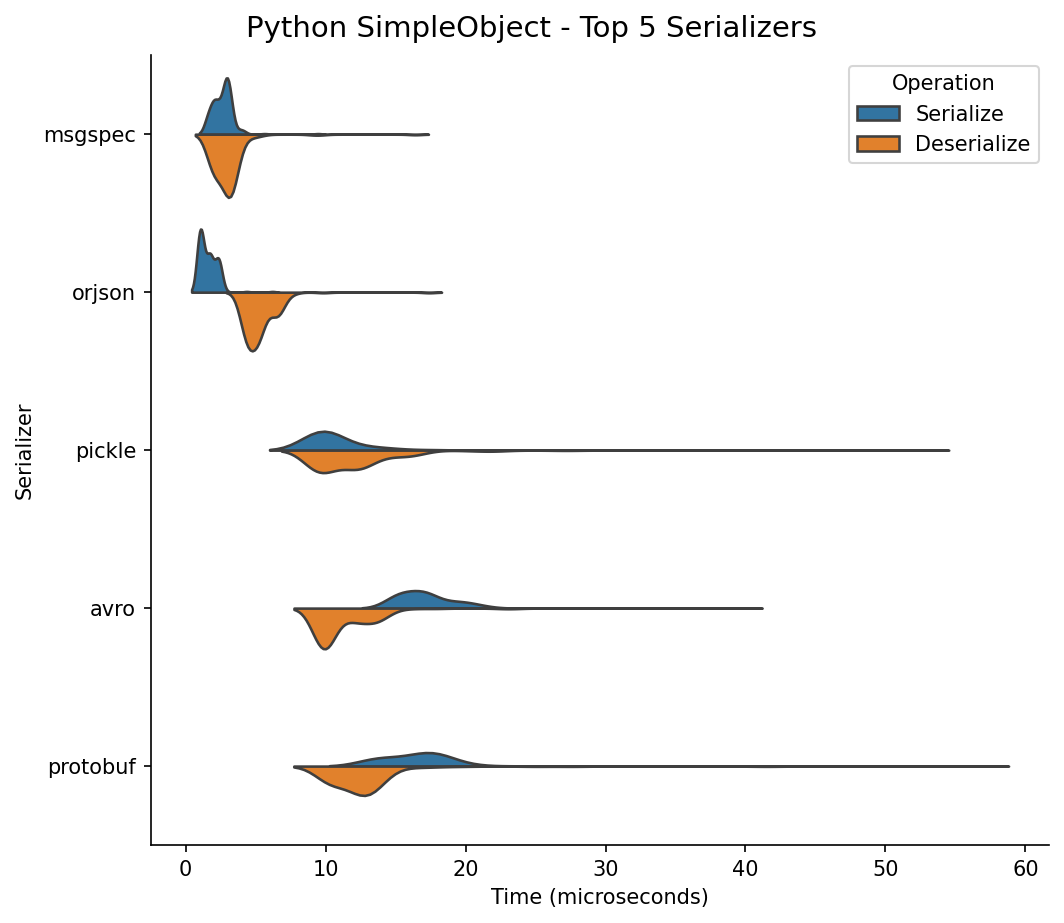
These violin plots visualize the serialization and deserialization performance across different data payloads for both C# and Python serializers. The shape of the "violin" represents the density of measurements: wider sections indicate more measurements at that particular time duration.
C# Serializers
Person (Complex Object)
Telemetry (Numeric Arrays)
EDI 835 (Deeply Nested)
String Array
Integer (Primitive Baseline)
Simple Object (Minimal Overhead)
Object Graph (Circular References)
Python Serializers
Person (Complex Object)
Telemetry (Numeric Arrays)
EDI 835 (Deeply Nested)
String Array
Integer (Primitive Baseline)
Simple Object (Minimal Overhead)
Object Graph (Circular References)