Python package
This part of the documentation covers the Python interface to the IRI2020 model. The Python package wraps the high-performance pure Rust implementation using PyO3 and exposes it as clean, user-friendly Python APIs returning xarray.Dataset objects.
Architecture
The Python codebase is located in:
src/iri2020/
Installation
You can install the package directly using standard Python package managers:
uv pip install .
This compiles the pure Rust core library and binds it into a Python extension module named iri2020.iri2020.
Quick Start
The main interface is the IRI function, which calculates ionospheric parameters for a specific time, geographic coordinates, and altitude range.
from datetime import datetime
import iri2020

# Calculate ionospheric parameters
dataset = iri2020.IRI(
    time=datetime(2020, 6, 21, 12, 0, 0),
    altkmrange=[100.0, 500.0, 10.0],  # Min altitude, Max altitude, Step size (km)
    glat=45.0,                         # Geographic latitude
    glon=-75.0                         # Geographic longitude
)

print(dataset)
API Reference
IRI
def IRI(
    time: str | datetime,
    altkmrange: list[float],
    glat: float,
    glon: float
) -> xarray.Dataset
Calculates the ionospheric parameters for a single location and time across a range of altitudes.
- Parameters:
time(strordatetime): Universal Time (UT) for the calculation. If a string is provided, it is parsed automatically.altkmrange(list[float]): A list of three floats specifying[min_altitude, max_altitude, step_size]in kilometers.glat(float): Geographic latitude in degrees.glon(float): Geographic longitude in degrees.- Returns: An
xarray.Datasetcontaining the computed parameters.
timeprofile
def timeprofile(
    tlim: tuple[datetime | str, datetime | str],
    dt: timedelta,
    altkmrange: list[float],
    glat: float,
    glon: float
) -> xarray.Dataset
Computes the altitude profile of the ionosphere over a specified time range for a fixed geographic location.
- Parameters:
tlim(tuple): A tuple of(start_time, end_time).dt(timedelta): Time step size.altkmrange(list[float]): A list of three floats specifying[min_altitude, max_altitude, step_size]in kilometers.glat(float): Geographic latitude in degrees.glon(float): Geographic longitude in degrees.- Returns: An
xarray.Datasetconcatenated along thetimedimension.
geoprofile
def geoprofile(
    latrange: tuple[float, float, float],
    glon: float,
    altkm: float,
    time: str | datetime
) -> xarray.Dataset
Computes the altitude profile at a single time and single altitude over a geographic latitude range.
- Parameters:
latrange(tuple): A tuple of(start_lat, end_lat, step_lat).glon(float): Geographic longitude in degrees.altkm(float): Altitude in kilometers.time(strordatetime): Universal Time (UT) for the calculation.- Returns: An
xarray.Datasetconcatenated along theglatdimension.
Output Dataset Schema
The returned xarray.Dataset contains the following variables:
| Variable Name | Description | Units |
|---|---|---|
ne |
Electron density | \(m^{-3}\) |
Tn |
Neutral temperature | K |
Ti |
Ion temperature | K |
Te |
Electron temperature | K |
nO+ |
Relative \(O^+\) abundance | % |
nH+ |
Relative \(H^+\) abundance | % |
nHe+ |
Relative \(He^+\) abundance | % |
nO2+ |
Relative \(O_2^+\) abundance | % |
nNO+ |
Relative \(NO^+\) abundance | % |
nCI |
Relative Cluster Ion abundance | % |
nN+ |
Relative \(N^+\) abundance | % |
NmF2 |
Peak electron density of the F2 layer | \(m^{-3}\) |
hmF2 |
Height of the peak electron density of the F2 layer | km |
NmF1 |
Peak electron density of the F1 layer | \(m^{-3}\) |
hmF1 |
Height of the peak electron density of the F1 layer | km |
NmE |
Peak electron density of the E layer | \(m^{-3}\) |
hmE |
Height of the peak electron density of the E layer | km |
foF2 |
F2-layer critical frequency | MHz |
TEC |
Vertical Total Electron Content | \(m^{-2}\) |
EqVertIonDrift |
Equatorial vertical ion drift velocity | m/s |
Attributes
f107: Solar radio flux index (\(F_{10.7}\)) proxy value.ap: Geomagnetic planetary index (\(A_p\)) value.
Visualization Examples
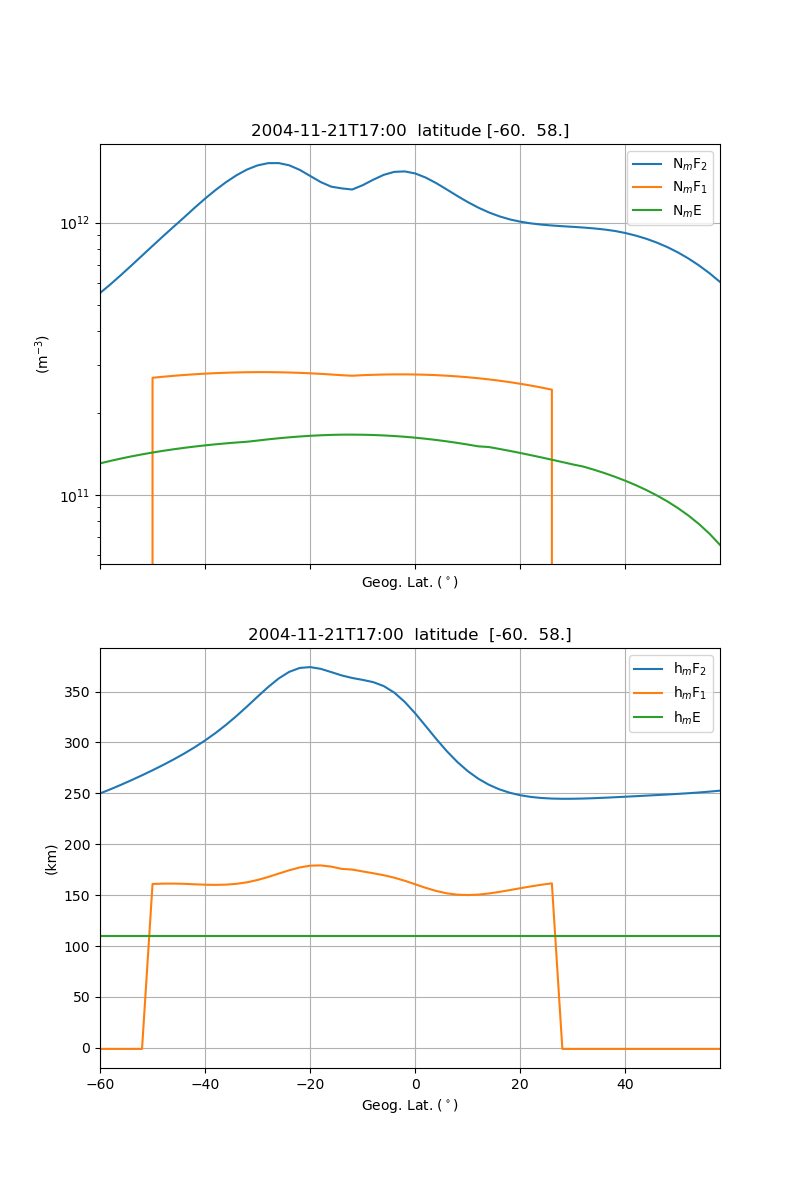
The package includes utility plotting functions under iri2020.plots to visualize the computed ionospheric results.
Altitude Profile
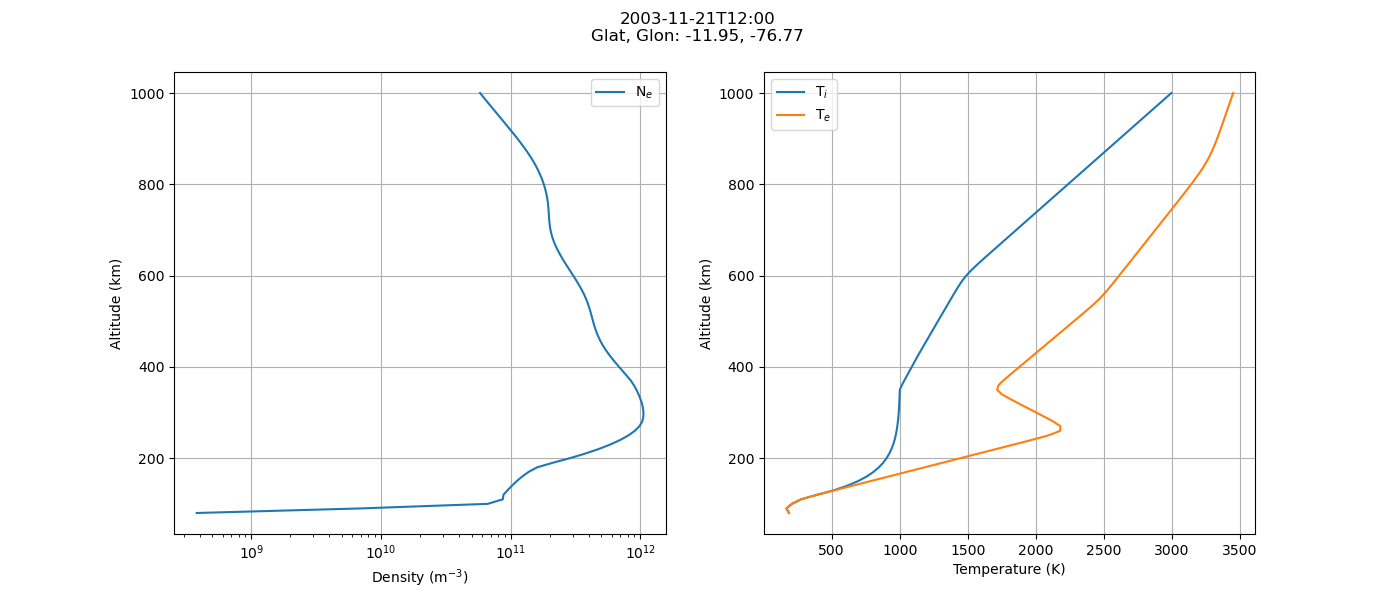
Shows electron density (\(N_e\)) and temperatures (\(T_i\), \(T_e\)) versus altitude:
import iri2020
import iri2020.plots as plots
from matplotlib.pyplot import show

# Compute and plot altitude profile
res = iri2020.IRI("2020-06-21", [100.0, 500.0, 10.0], 45.0, -75.0)
plots.altprofile(res)
show()
Time Profile
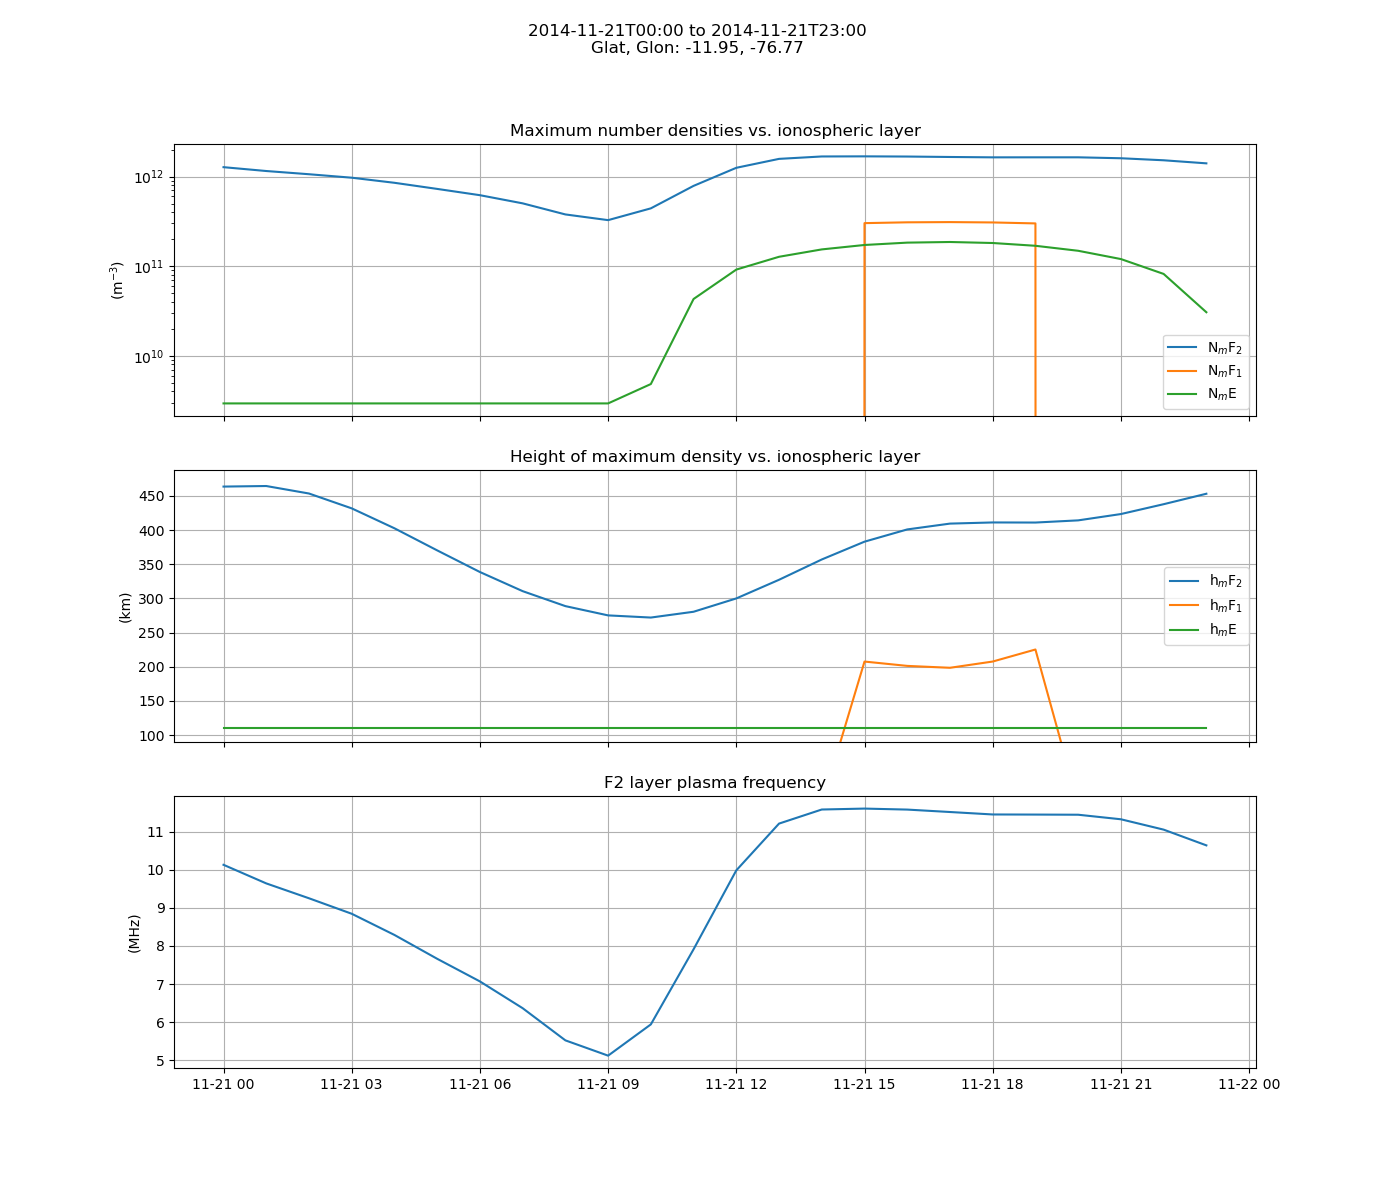
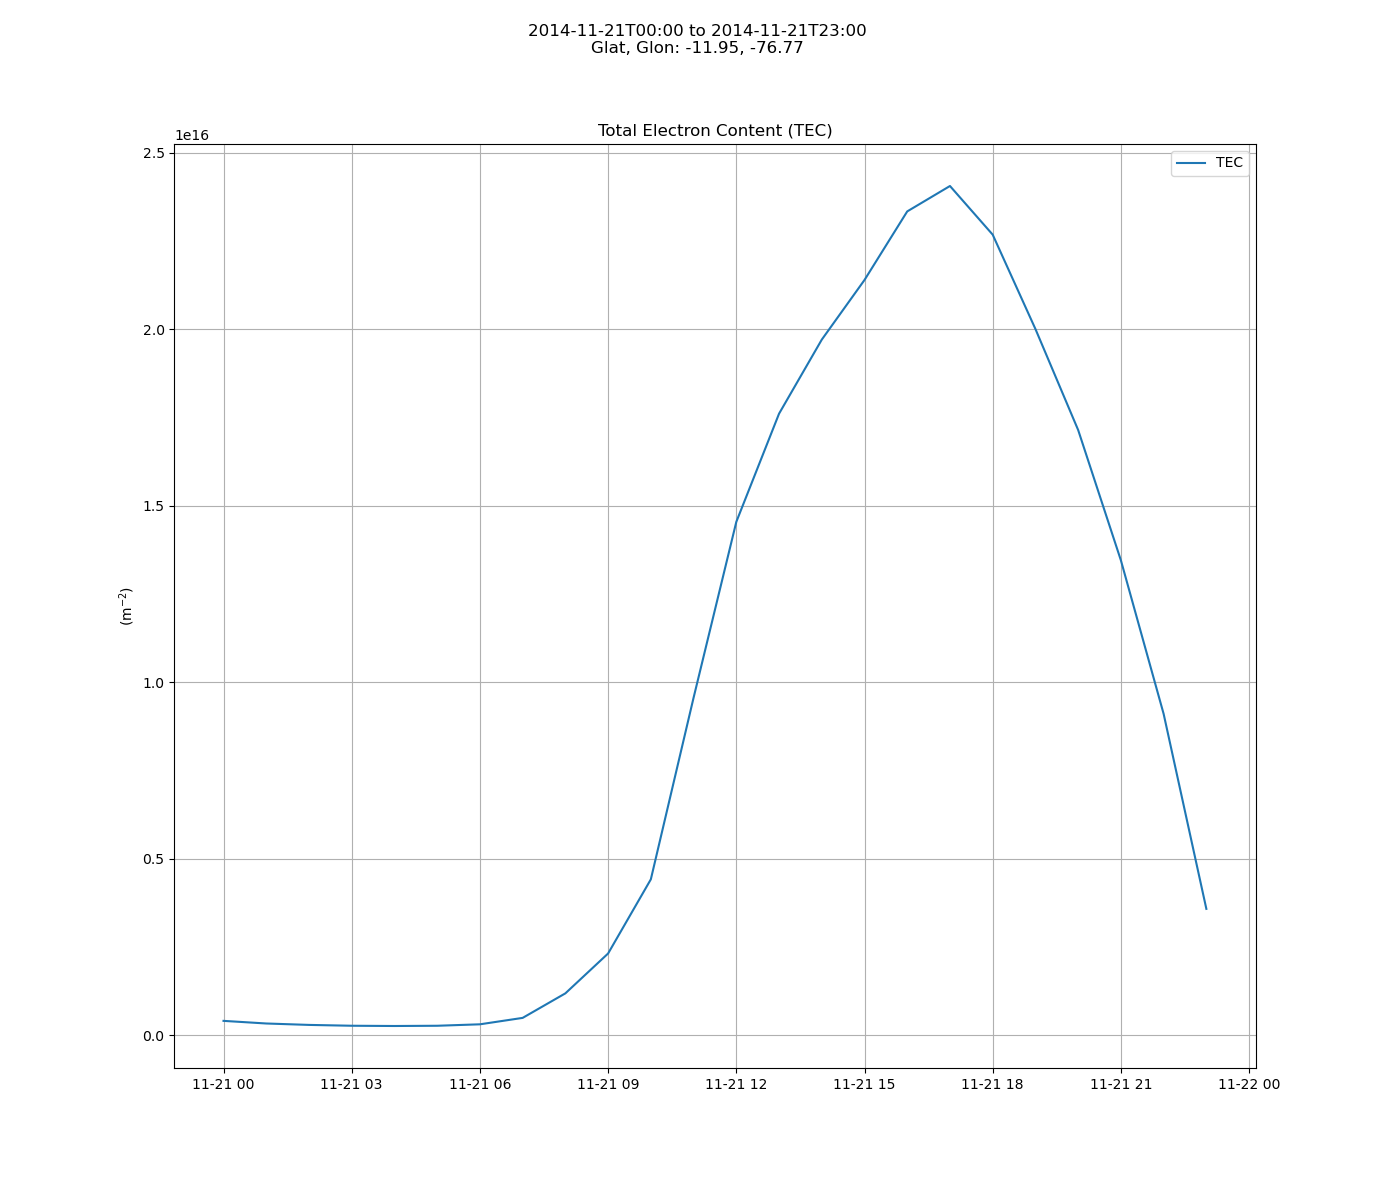
Plots F2/F1/E layer densities, heights, foF2 frequency, and vertical Total Electron Content (TEC) over time:
from datetime import timedelta
import iri2020
import iri2020.plots as plots
from matplotlib.pyplot import show

# Compute and plot time profile
res = iri2020.timeprofile(
    tlim=("2020-06-21", "2020-06-22"),
    dt=timedelta(hours=1),
    altkmrange=[100.0, 500.0, 10.0],
    glat=45.0,
    glon=-75.0
)
plots.timeprofile(res)
show()
Latitude Profile
Plots densities and heights over a range of geographic latitudes:
import iri2020
import iri2020.plots as plots
from matplotlib.pyplot import show

# Compute and plot latitude profile
res = iri2020.geoprofile(latrange=(-60.0, 60.0, 2.0), glon=-75.0, altkm=300.0, time="2020-06-21")
plots.latprofile(res)
show()